Using the FINRA Fund Analyzer
FINRA Fund Analyzer Overview | What's New | Types of Calculations Available in the Fund Analyzer | Using Search | Understanding the Analyzer's Results | Share the Results of Your Analysis | Printing or Saving Your Analysis | Help | Feedback | Using the Advanced Options
How to Configure the Fund Analyzer for Transaction ("Clean") Share Calculations
Types of Calculations Available in the Fund Analyzer
Depending on your fund selections and the advanced options you employ, the Fund Analyzer can evaluate the following scenarios:
1. Same Fund, Different Share Class, Same Account Type
Compare different share classes of the same mutual fund in terms of cost and account value. For example, within a brokerage account, compare owning an A-share to a C-share of XYZ Fund. The account and mutual fund are the same. Only the share class differs. The comparison helps you select an appropriate option for your situation.
Many funds offer several ways to pay for your fund. They are called share classes. The actual securities in the fund's portfolio are the same. How you pay is what changes.
Your total cost and account value will vary according to the share class you choose. The Fund Analyzer allows you to do comparisons easily, quickly, and accurately.
To configure this analysis:
- Select the same mutual fund with different share classes using the Search tool.
- Adjust any parameters, such as the investment amount, return, or holding period for your situation.
- Click Analyze.
2. Same Fund, Same Share Class, Different Account Type
Compare different account types, all else equal, in terms of cost and account value. For example, compare owning a specific ETF within a brokerage account to owning it within a wrap account. The fund and share classes are the same. Only the account type differs. The comparison helps you select an appropriate option for your situation. (For a mutual fund A-share, the Fund Analyzer automatically waives the front-end load for the advisory account option.)
Most brokerage firms offer several types of accounts. Within and among firms, the fees associated with the accounts can vary widely. Commissions tied to trading activity are assessed with brokerage accounts. Annual asset-based advisory fees are assessed with advisory accounts. Trading activity has little bearing on fees.
Your total cost, account value, and the pay to your advisor will vary according to the account type you choose. The Fund Analyzer allows you to do comparisons easily, quickly, and accurately.
To configure this analysis:
- Select the desired fund and duplicate it into an additional scenario using the Search tool (Use the Plus sign).
- Adjust any parameters, such as the investment amount, return, or holding period for your specific situation.
- Define the advisory account (also called a "wrap account") using the Wrap Account and Flat Fees advanced option.
- If trades of the fund or ETF create a fee, such as for transaction shares or ETFs in the example above, define the Trade Cost & Annual Turnover parameters and the Loads, Commissions and CDSCs options as needed.
- Click Analyze.
3. Same Fund, Same Share Class, Different Brokerage Firm
Compare different brokerage costs, all else equal, in terms of cost and account value. For example, compare owning a specific ETF within a brokerage account at ABC firm to owning it at XYZ firm. The fund and share classes are the same. Only the firm-level fees differ at the account level. The comparison helps you select an appropriate option for your situation.
All brokerage firms offer brokerage accounts. Within and among firms, the fees associated with the accounts can vary widely. Also, the shareholder benefits available at one firm may not be available at another, such as rights of accumulation (ROA), free exchanges, or letters of intent (LOI). This difference is common with so-called "clean shares." In rare cases, a difference in benefits also occurs with load shares.
Your total cost, account value, and pay to your advisor will vary according to the brokerage firm you use and benefits it offers. The Fund Analyzer allows you to do comparisons easily, quickly, and accurately.
To configure this analysis:
- Select the desired fund and duplicate it into an additional scenario using the Search tool (Use the Plus sign).
- Adjust any parameters, such as the investment amount, return, or holding period for your specific situation.
- Define the advisory account (also called a "wrap account") using the Wrap Account and Flat Fees advanced option.
- If trades of the fund or ETF create a fee, such as for transaction share mutual funds or ETFs in the example above, define the Trade Cost & Annual Turnover parameters and the Loads, Commissions and CDSCs parameters as needed. Note that the commissions may be different at different brokerage firms.
- Adjust any Rights of Accumulation or Letter of Intent options, as needed, depending on whether the brokerage firms offer these benefits.
- Click Analyze.
4. Same Fund, Same Share Class, Different Platform
Compare different brokerage platforms, all else equal, in terms of cost and account value. For example, compare owning a no-load fund within a brokerage account, under one platform pricing option, to owning it under a different platform pricing option. The fund and share class are the same. Only the firm-level fees and services differ at the platform level. The comparison helps you select an appropriate option for your situation.
At many firms, different brokerage services are provided depending on the fund and/or investor's total assets with the firm. Fees also may vary. This is common with firms' so-called "NTF platforms." NTF stands for No Transaction Fee. Trades executed online — on the NTF platform — may be free while those done over the phone, or assisted by a broker, may create a fee (called a ticket charge or may be deemed a commission). Also, annual account maintenance fees may be waived for larger accounts. Finally, shareholder benefits available on a regular brokerage platform are not always available on an NTF platform, such as rights of accumulation (ROA), free exchanges, or letters of intent (LOI).
Your total cost, account value, and pay to your advisor will vary according to the fees and benefits associated with the platform you choose. The Fund Analyzer allows you to do comparisons easily, quickly, and accurately.
To configure this analysis:
- Select the desired fund and duplicate it into an additional scenario using the Search tool (Use the Plus sign).
- Adjust any parameters, such as the investment amount, return, or holding period for your specific situation.
- If trades of the fund or ETF create a fee, such as for transaction shares or ETFs in the example above, define the Trade Cost & Annual Turnover parameters and the Loads, Commissions and CDSCs parameters as needed. Note that the commissions may be different at different brokerage firms. Further, a custom commission or load may not be required if using prospectus-based pricing.
- Adjust any Rights of Accumulation, Letters of Intent or Account Aggregation options, as needed, depending on whether the brokerage firms offer these benefits.
- Define any Ticket Charges that may apply to trades on the platform.
- Define any Flat Fees that may apply at the trade or account level.
- Click Analyze.
5. Different Fund, Same Share Class, Same Account Type
Compare different funds of the same share class, using the same account type, in terms of cost and account value. For example, within a brokerage account, compare owning the A-share of XYZ's Growth Fund to the A-share of PDQ's Growth Fund. The account-type and share class are the same. Only the fund differs. The comparison helps you select an appropriate option for your situation.
Many fund companies offer good products and a variety of ways to pay for them (e.g., share classes). The actual securities in the funds' portfolios will differ. How you pay is not always the same, however, even if you use the same share class. For example, the top A-share load is 5% for ABC funds but 4.50% for PDQ Funds. Expense ratios are higher, overall, at PDQ. Finally, C-shares convert to lower-cost A-shares at ABC but not at PDQ.
Your total cost, account value, and the pay to your financial professional will vary according to the fund, share class, and account type that you choose. The Fund Analyzer allows you to do comparisons easily, quickly, and accurately.
To configure this analysis:
- Select the desired funds and their similar share classes using the Search tool.
- Adjust any investment parameters, such as the investment amount, return or holding period, for your specific situation.
- Adjust any Rights of Accumulation or Letter of Intent options as desired.
- Click Analyze.
6. Different Fund, Different Share Class, Same Account Type
Compare different funds of different share classes in terms of cost and account value. For example, within a brokerage account, compare owning the A-share of XYZ's Growth Fund to the C-share of PDQ's Bond Fund. The account-type is the same. The funds and shares differ. The comparison helps you select an appropriate option for your situation.
Many fund companies offer good products and a variety of ways to pay for them (e.g., share classes). For example, the top A-share load is 4.25% for ABC funds. By industry standards, that is low. The fast conversion feature for C-shares of PDQ's funds, however, holds strong appeal. Expense ratios certainly will differ among the two share classes.
Your total cost, account value, and the pay to your advisor will vary according to the fund, share class, and account type that you choose. The Fund Analyzer allows you to do comparisons easily, quickly, and accurately.
To configure this analysis:
- Select the desired funds and share classes using the Search tool.
- Adjust any parameters, such as the investment amount, return, or holding period for your situation.
- If trades of the fund or ETF create a fee, such as for transaction shares or ETFs in the example above, define the Trade Cost & Annual Turnover parameters and the Loads, Commissions and CDSCs parameters as needed. Note that the commissions may be different at different brokerage firms. Further, a custom commission or load may not be required if using prospectus-based pricing.
- Adjust any Rights of Accumulation or Letters of Intent options as desired.
- Click Analyze.
7. Different Fund, Different Share Class, Different Account Type
Compare the use of different funds, different share classes, and different account types in terms of cost and account value. The comparison might reflect different investment goals and strategies for achieving them. For example, you save for college using mutual funds in a brokerage account and employ a buy and hold strategy. You save for retirement using ETFs in an advisory account and trade actively. The ability to compare disparate approaches helps you select options, and make decisions, that are appropriate for your situation.
Many brokerage firms offer a variety of investments, pricing options, and account types. Depending on your personal situation, some combination of options may be best in one case but not the other. Retirement accounts, for example, often limit the permissible share classes. Moreover, for active traders, often it makes sense to use no-load funds and/or ETFs within an advisory account since trades are free. When aggregate holdings at one fund firm are large, and trades occur within a brokerage account, load-waived A-shares may make sense when the trades may be done at NAV (i.e., without sales charges).
Your total cost, account value, and the pay to your advisor will vary according to the fund, share class, and account type that you choose. The Fund Analyzer allows you to do comparisons easily, quickly, and accurately.
To configure this analysis:
- Select the desired funds and share classes using the Search tool.
- Adjust any parameters, such as the investment amount, return, or holding period for your specific situation.
- If trades of the fund or ETF create a fee, such as for transaction shares or ETFs in the example above, define the Trade Cost & Annual Turnover parameters and the Loads, Commissions and CDSCs parameters as needed. Note that the commissions may be different at different brokerage firms. Further, a custom commission or load may not be required if using prospectus-based pricing.
- Define any Rights of Accumulation or Letters of Intent options as needed.
- Define any advisory account (also called "wrap" account) fees.
- Click Analyze.
8. Different Investment, Same Platform, Same Pricing
Compare different investment options, all else equal, in terms of cost and account value. For example, compare owning a no-load fund on an NTF platform to owning a load waived A-share on the same platform. The platform and its pricing are the same. Only the investments differ. The comparison helps you select an appropriate option for your situation.
At many firms, different brokerage services are provided depending on the investment type and/or investor's total assets with the firm. The distinctions are reflected by the available platforms. Typically, platforms offer many investment options. No Transaction Fee (or "NTF") platforms are common. Trades executed online, for example, may be free at the account level. Other account-level fees may apply, though they are equal for all investments. At the investment level, however, there may be a wide disparity in internal pricing.
Your total cost, account value, and pay to your advisor will vary according to the investment options you choose. The Fund Analyzer allows you to do comparisons easily, quickly, and accurately.
To configure this analysis:
- Select the desired investments (e.g., funds) using the Search tool.
- Adjust any parameters, such as the investment amount, return, or holding period for your situation.
- If trades of the fund or ETF create a fee, such as for ETFs, or no-load funds in the example above, define the Trade Cost & Annual Turnover parameters and the Loads, Commissions and CDSCs parameters as needed. In this case, set trading frequency (e.g., turnover) and the custom load or commission to be the same for all the scenarios you are analyzing to ensure the same pricing applies.
- Adjust any Rights of Accumulation, Letter of Intent or Account Aggregation option, as needed, depending on whether the brokerage firm offers these benefits.
- Define any Ticket Charges that may apply to either fund or platform.
- Click Analyze.
9. Different Investments, Same Platform, Different Pricing
Compare different investment options, with different account-level pricing, in terms of cost and account value. For example, compare owning a no-load fund and a load-waived A-share on ABC brokerage firm's mutual fund platform. Due to how fund companies pay ABC brokerage for "shelf space" exposure, no-load funds are subject to ticket charges upon a trade. A-shares are not subject to them. The platform is the same. The investments and certain fees differ. The comparison helps you select an appropriate option for your situation.
Your total cost, account value, and pay to your advisor will vary according to the investments you choose and applicable account-level pricing. The Fund Analyzer allows you to do comparisons easily, quickly, and accurately.
To configure this analysis:
- Select the desired investments (e.g., funds) using the Search tool.
- Adjust any parameters, such as the investment amount, return, or holding period for your situation.
- If trades of the fund or ETF create a fee, such as for ETFs, or no-load funds in the example above, define the Trade Cost & Annual Turnover parameters and the Loads, Commissions and CDSCs parameters as needed. For a load-waived share, turn off loads by setting "Apply Front Load" to "No" for the desired fund.
- Adjust any Rights of Accumulation, Letter of Intent or Account Aggregation options, as needed, depending on whether the brokerage firm offers these benefits.
- Define any Ticket Charges that may apply.
- Click Analyze.
10. Different Investment, Different Platform, Different Pricing
Compare different investments, on different platforms, with different pricing in terms of cost and account value. The comparison might reflect different investment goals and strategies for achieving them. For example, you save for college using ETFs in a brokerage account, using their equities platform, and employ a buy and hold strategy. You save for retirement using no-load mutual funds, also in a brokerage account, but on the firm's NTF platform and trade actively. (NTF stands for no transaction fee.) The ability to compare disparate approaches helps you select options, and make decisions, that are appropriate for your situation.
At many firms, different brokerage services are provided depending on the investment type and/or investor's total assets with the firm. The distinctions are reflected by the available platforms. Firms may offer several platforms and, for each one, the investments offered, services available, and fees charged may vary. Moreover, platforms may vary in the same ways across brokerage firms.
Your total cost, account value, and pay to your advisor will vary according to the investments, the platforms they are on, and the associated fees. The Fund Analyzer allows you to do comparisons easily, quickly, and accurately.
To configure this analysis:
- Select the desired investments (e.g., funds) in the Search tool.
- Adjust any parameters, such as the investment amount, return, or holding period for your situation.
- If trades of the fund or ETF create a fee, such as for ETFs or no-load funds in the example above, define the Trade Cost & Annual Turnover parameters and the Loads, Commissions and CDSCs parameters as needed. For a load-waived share, turn off loads by setting "Apply Front Load" to "No" for the desired fund.
- Adjust any Rights of Accumulation, Letter of Intent or Account Aggregation options, as needed, depending on whether the brokerage firm offers these benefits.
- Define any Ticket Charges that may apply to either fund or platform.
- Define any advisory account (also called a "wrap" account) or flat fees that may apply.
- Click Analyze.
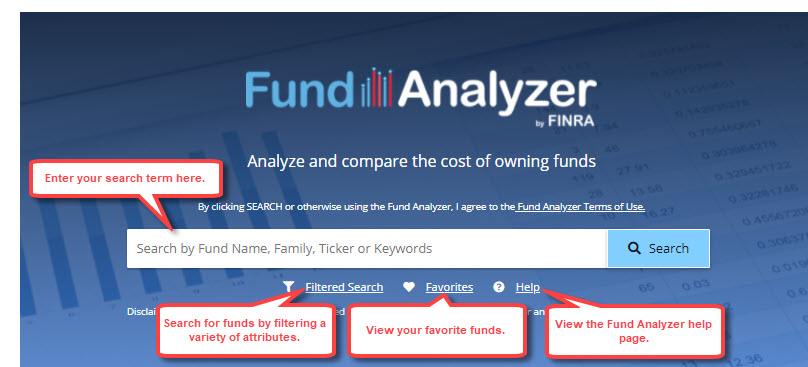
Using Search
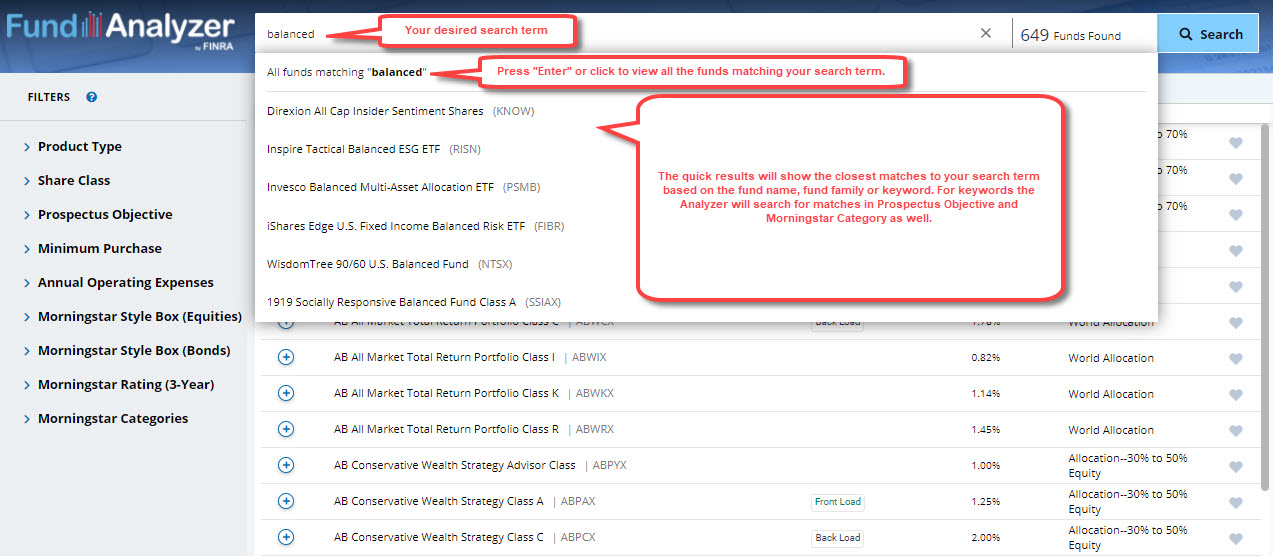
Search for a mutual fund, ETF, ETN or money market fund by entering any of the following:
- Ticker Symbol (e.g., ABCDX)
- Fund Name (e.g., ABC Capital Appreciation Fund)
- Fund Family Name (e.g., Aberdeen, Janus, Vanguard)
- Keyword (e.g., aggressive, conservative, balanced, etc.)
The Quick Results will show the closest matches to your search term based on the fund name, ticker, fund family, or keyword. The Analyzer will also search for matches in the Prospectus Objective and Morningstar Category.
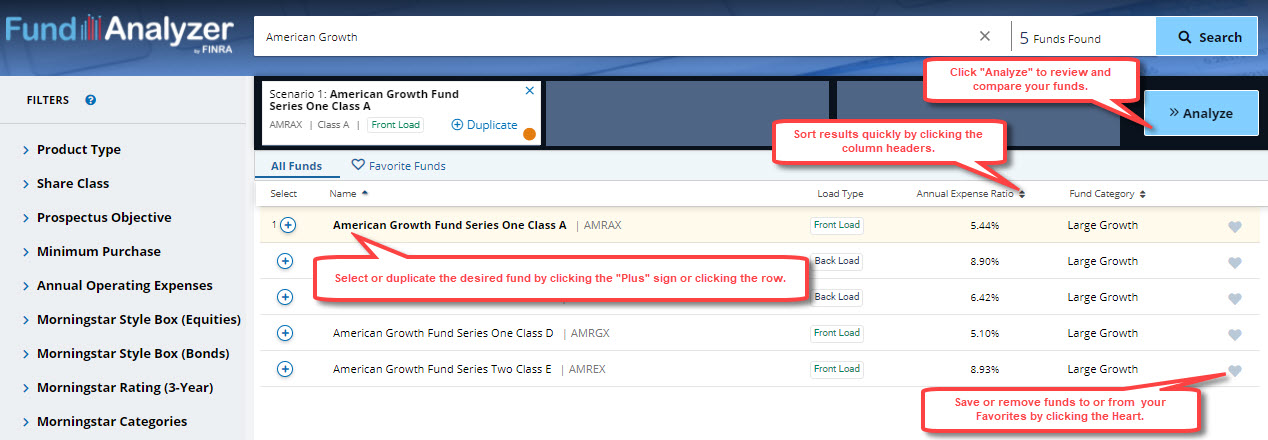
To select a fund, click the "Plus" symbol or the fund row. Your selected funds will appear in your selection basket at the top of the page. You can select up to three funds to compare. To select other funds, first delete individual funds from the basket by clicking the "X" in the upper right corner of the particular fund box.
You can duplicate a fund to examine how different cost structures and ownership scenarios impact cost and account value.
Sort the results by name, annual expense ratio, or fund category by clicking on the column headers.
Save funds to your Favorite Funds list by clicking the heart icon in the right-hand column. Remove them from your Favorites by clicking the "X" symbol.
Click "Analyze" to review and compare your funds' cost information and past performance.
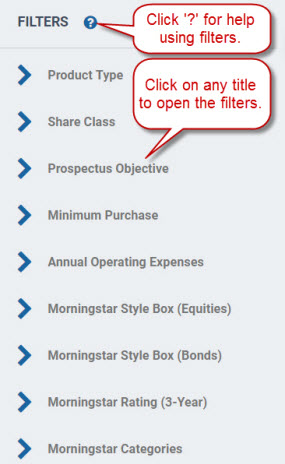
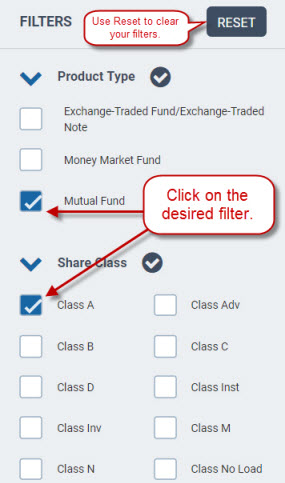
Using Search Filters to Find Funds
The Fund Analyzer includes a powerful suite of search filters. These filters can quickly narrow down your available choices.
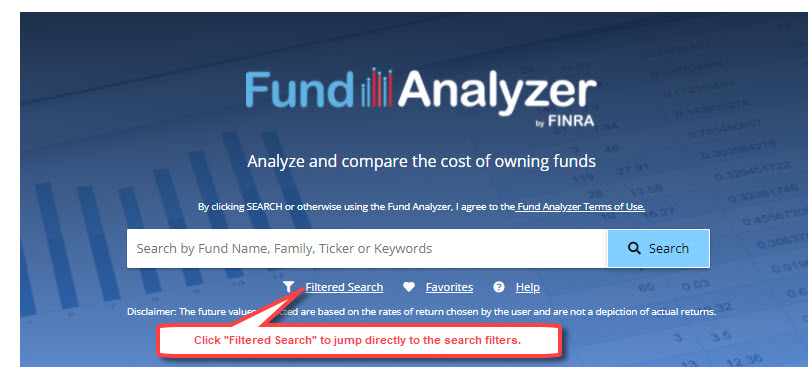
To use a filtered search, on the Analyzer home page, click the "Filtered Search" link. While viewing your results, click the desired filter icon. You can filter by any regular keyword or name search. Your results will automatically be reduced as you set additional filters. To clear your filter settings, click the "Reset" button.
Understanding the Analyzer's Results
Results Summary
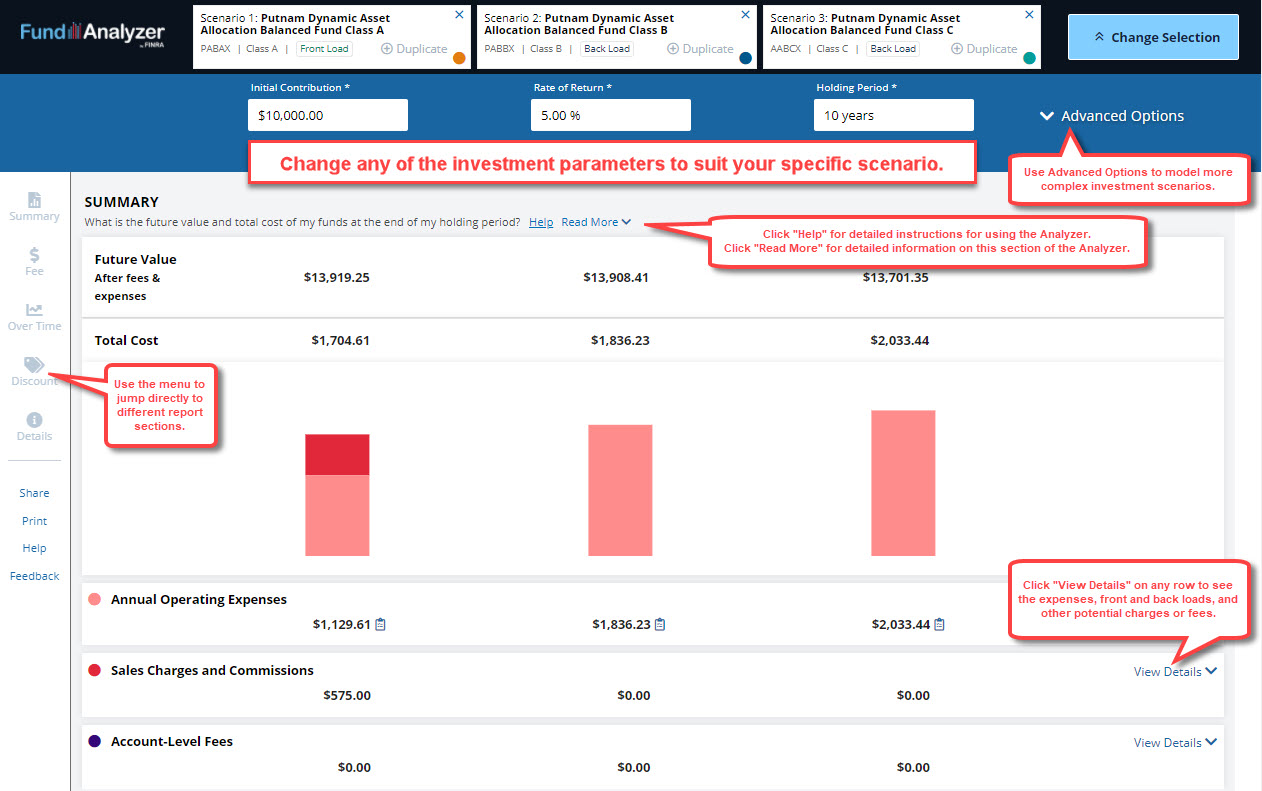
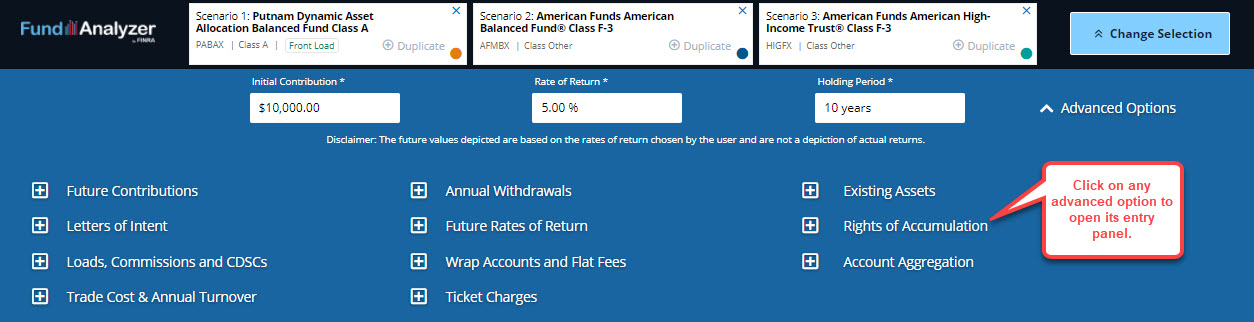
When you first click "Analyze" the Fund Analyzer will calculate the total costs and projected future account values (after expenses) of your selected funds. The initial display will show the results for these investment parameters:
- Initial Contribution: $10,000.00
- Rate of Return: 5%
- Holding Period: 10 years
You can change these values by clicking them and entering the desired values for your scenario. The Analyzer will update your results automatically. Click "Read More" in the Summary section to display details of the items in this section. Use the Advanced Options to model more complex scenarios. They include using an advisory account, making future contributions and withdrawals, and electing ROA and LOI benefits, among many other options.
The future value of your investments, after the deduction of fees and expenses, at the holding period noted, will display.
A chart displays the cost components of your scenario. They include annual operating expenses, sales charges and commissions (i.e., front- and back-loads, brokerage commissions, and any account-level fees you entered via the Advanced Options section). You can view the details of each component in the rows below the chart. Clicking "View Details" will display additional information such as the operating expense ratio, front- or back-load schedules, and a breakdown of account-level fees (if applicable).
You can use the left menu to quickly jump from one section of the report to another.
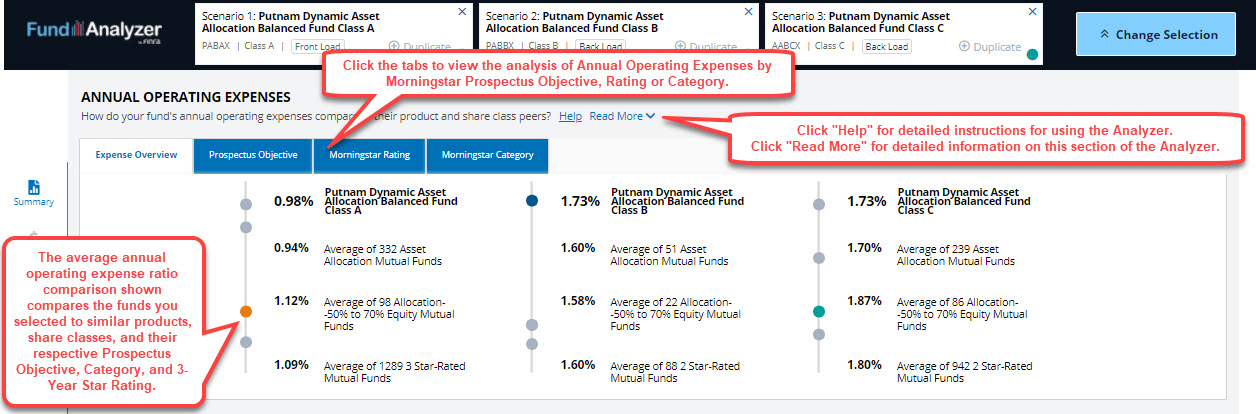
Annual Operating Expenses
The Analyzer compares your selected fund's annual operating expense ratio to the average for similar funds. The comparisons are based on product type, share class, and the Morningstar Prospectus Objective, Morningstar Category, and Morningstar 3-Year Star Rating. Average expense ratios for each subset of funds are shown alongside your fund's expense ratio.
Clicking the Read More link will provide additional details. You can also mouse-over the marker dots to see where other funds fall in terms of operating expenses.
Fund Cost and Value Over Time
Total Cost | Future Value | Contributions and Withdrawals | Return Over Time | Trade Frequency
The Fund Analyzer will calculate and graph the total cost, future value, and contributions and withdrawals for your selected funds. Also, it displays all the data for each year of your investment scenario.
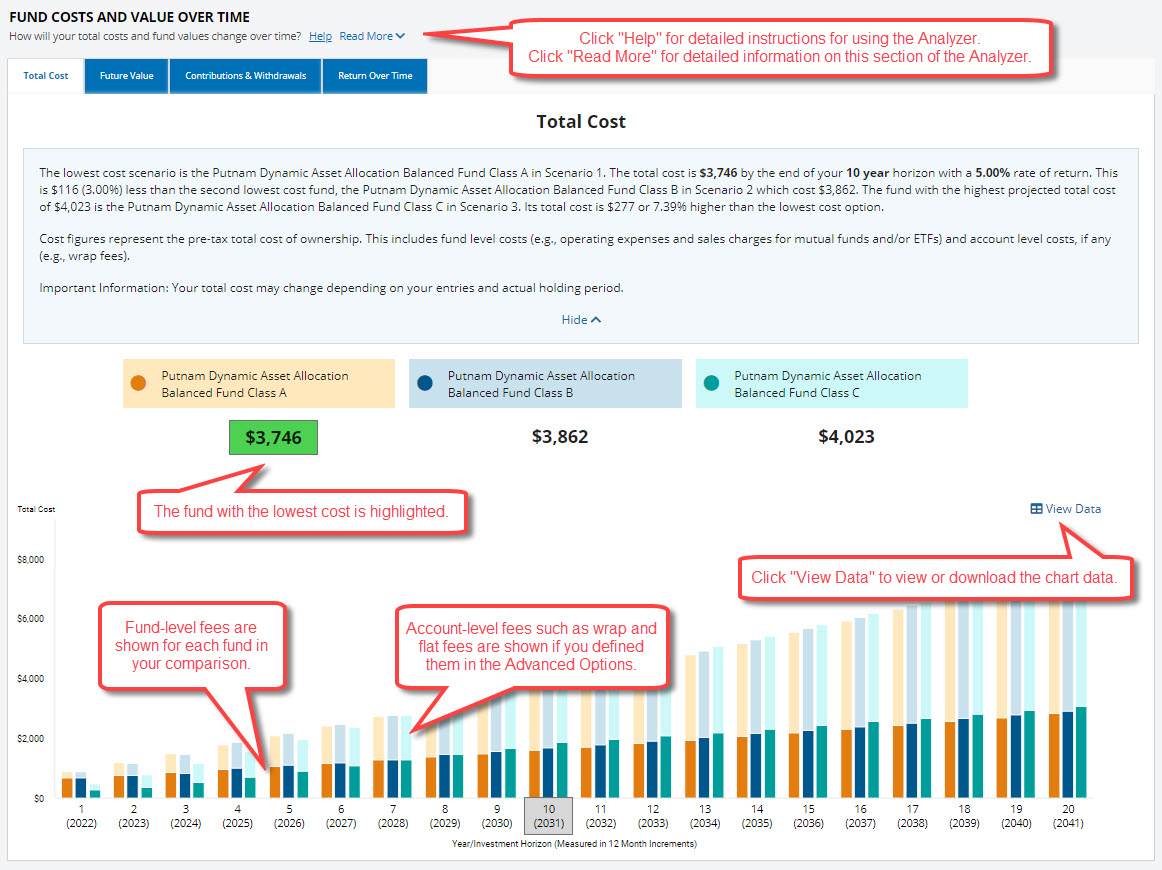
Total Cost
The total costs for your scenario are shown. The fund(s) with the lowest cost for your holding period and rate of return are highlighted. You can display the account-level or fund-level cost by mousing over any of the data bars.
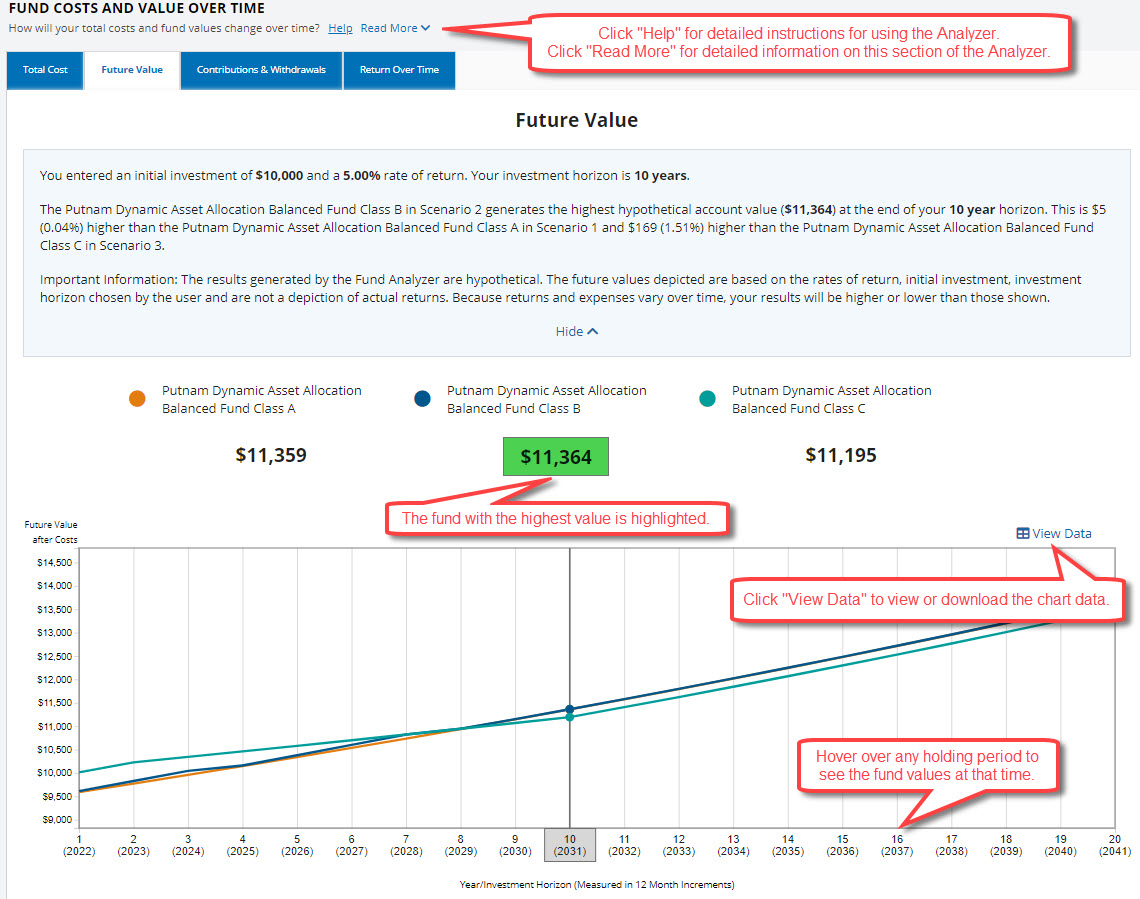
Future Value
The future values of your investments reflect the deduction of all product-level and account-level fees and expenses. The fund with the highest projected account value, given your holding period and rate of return, is highlighted. You can display the values at any holding period by mousing over the data points. You can view and download the data tables in CSV format by clicking the "View Data" button.
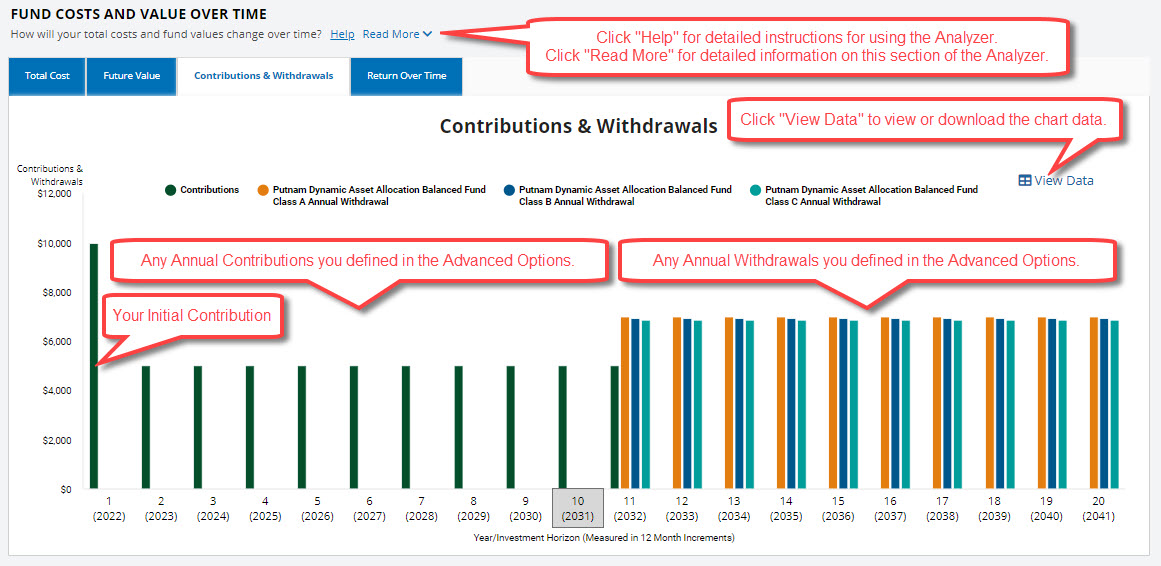
Contributions and Withdrawals
The Analyzer can model the impact of your initial contribution, future contributions, and withdrawals. Results for account value, cost, and pay reflect all modeled contributions and withdrawals.
Contributions occur at the beginning of the year prior to any fees being assessed. Withdrawals occur at year-end, after all fees have been assessed.
Withdrawals must start at year-end three or later. They are made after any return is earned by the then-current assets. This is equivalent to the beginning of the next year — before any contributions are made or return is earned in that year. For example, withdrawals start at the end of year ten. That is after all return is earned during the tenth year, and before the 11th year begins.
Withdrawals must start after all contributions have ended. Otherwise an error message will appear. For example, you cannot make contributions for six years but start withdrawals after four.
Future Contributions and withdrawals must be defined in the Advanced Options section. Once results are displayed, you can view the individual values by mousing over the data bars.
To reduce the complexity of the analysis, if you model a transaction share, Future Contributions are limited to years one and two and custom Future Rates of Return are disabled. If transaction share pricing is not elected, then full functionality exists.
You can view and download the data tables in CSV format by clicking the View Data button.
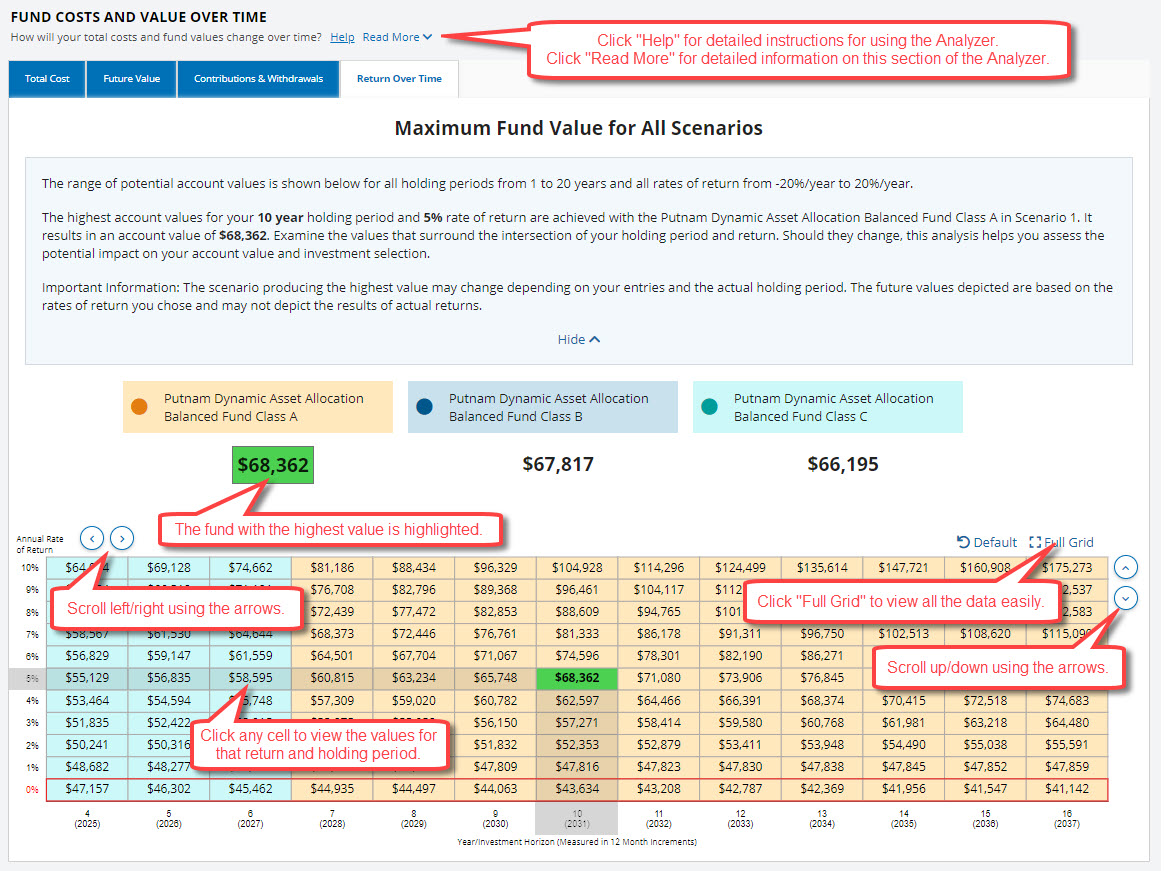
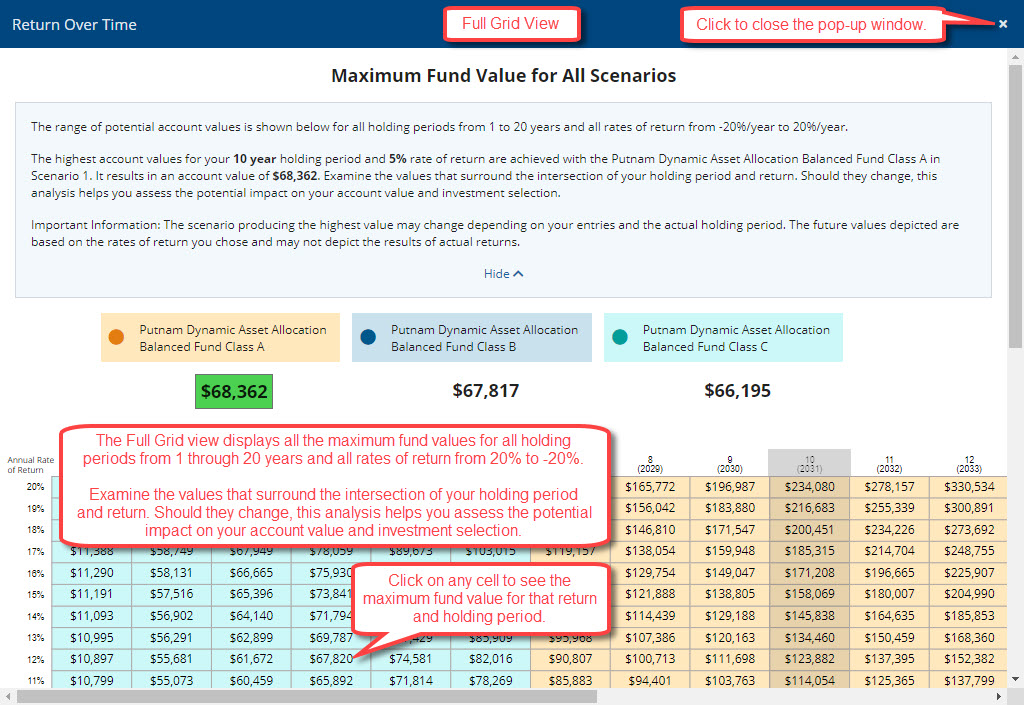
Return Over Time
The Return Over Time tab will display the range of account values for all holding periods from 1 to 20 years and all rates of return from -20%/year to 20%/year. The fund(s) with the maximum value for your holding period and rate of return are highlighted.
You can view the values for any holding period by mousing over the data points. Examine the values that surround the intersection of your holding period and return. Should either one change, you can readily assess the impact on your account value, costs, and investment selections.
Scroll up/down or left/right using the arrow buttons. The Full Grid button will display all the values for all holding periods and rates of return in a single window.
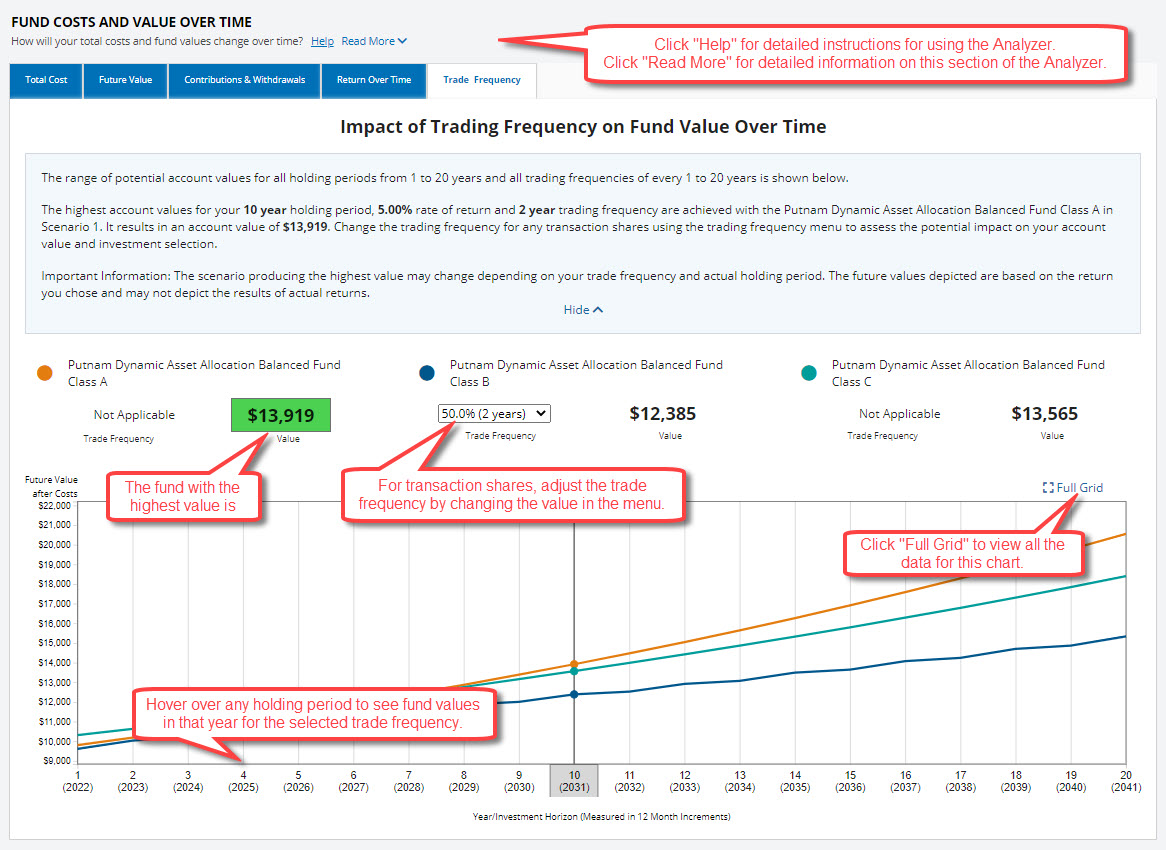
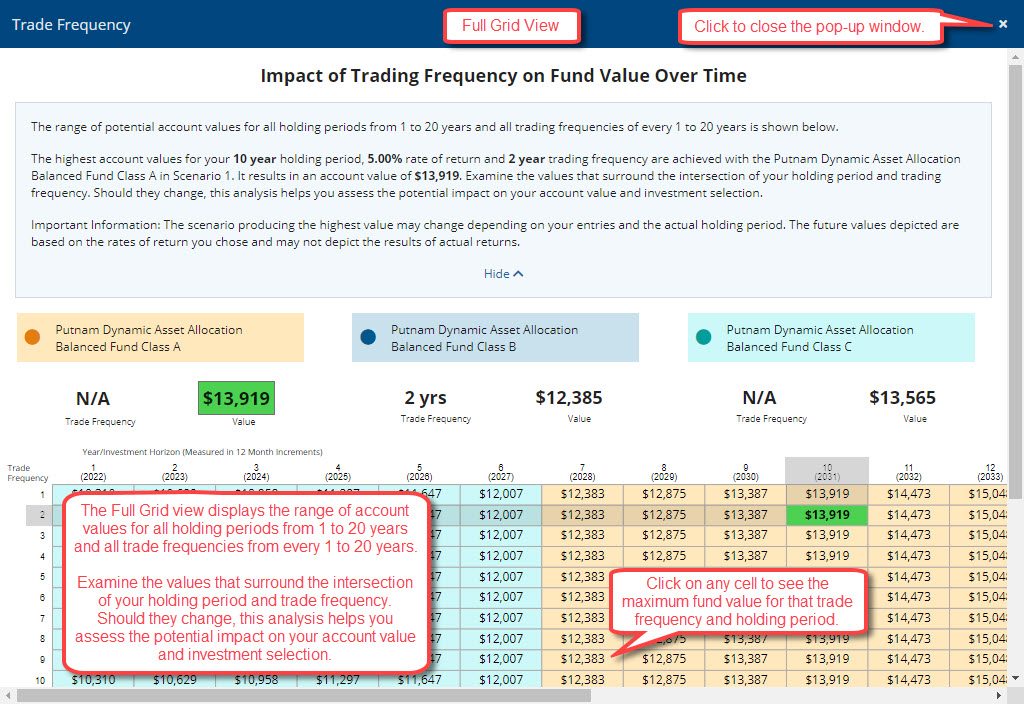
Trade Frequency
Once you configure transaction shares via the Advanced Options, the Trade Frequency tab will become visible. It displays account values for all holding periods from 1 to 20 years for the trade frequency you defined (e.g., 25%/yr., which is every four years). The fund with the highest projected account value at your holding period and trade frequency (e.g., 10 years and 25% per year) will be highlighted. You can view the values at any holding period by mousing over the data points.
You can change the trade frequency for any transaction share using the dropdown menu. The data and chart in this tab will update. This ability helps you examine the impact of various trading frequencies on costs and account values.
Use the Full Grid button to display, in a single window, all values for all holding periods and trading frequencies. Examine the values that surround the intersection of your holding period and trade frequency. Should either one change, you can readily assess the impact on your account value, costs, and investment selections.
"Transaction Shares" is a term that applies to any share of any fund whereby a transaction generates a sales load or commission, post the initial investment. Traditional load shares — A, B, or C — can be considered transaction shares when, for example, assets are traded among fund firms. In such cases, the free exchange privilege does not apply and thus, a new load applies.
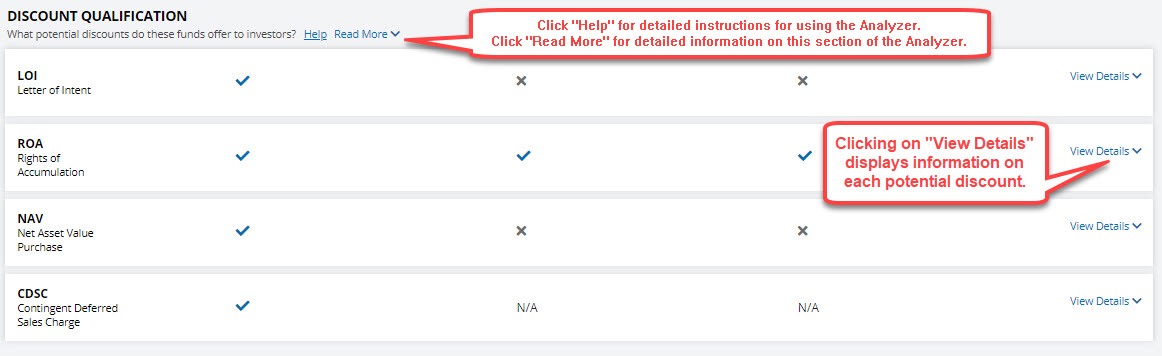
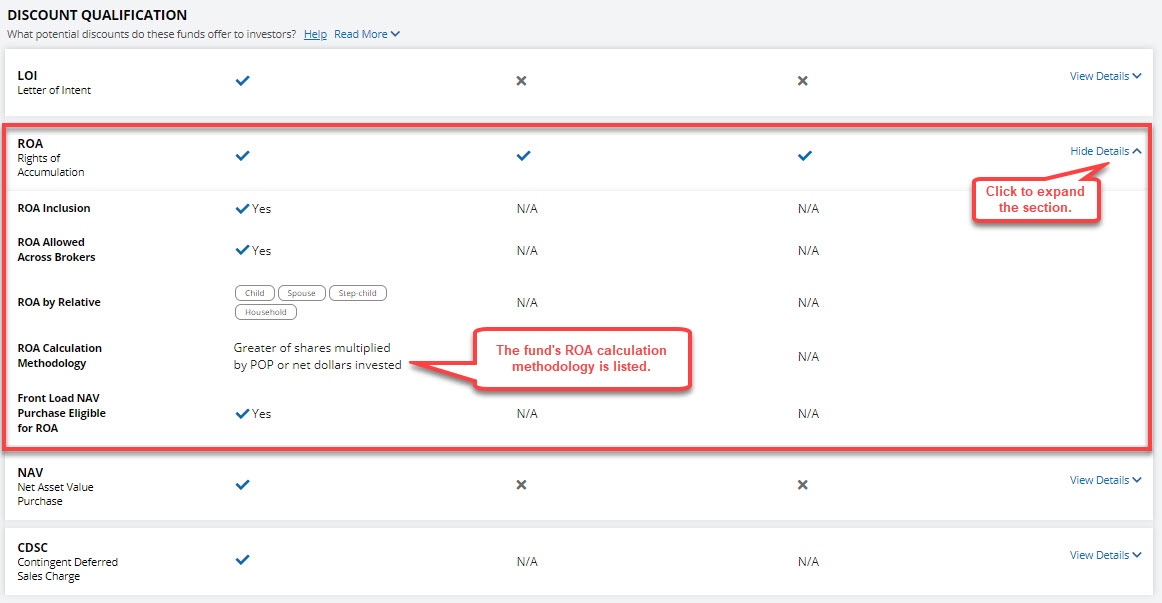
Discount Qualification
The Analyzer includes data on available discounts. These discounts are reported by each mutual fund. To view the data, click View Details. Click the Read more link to see definitions of the discounts.
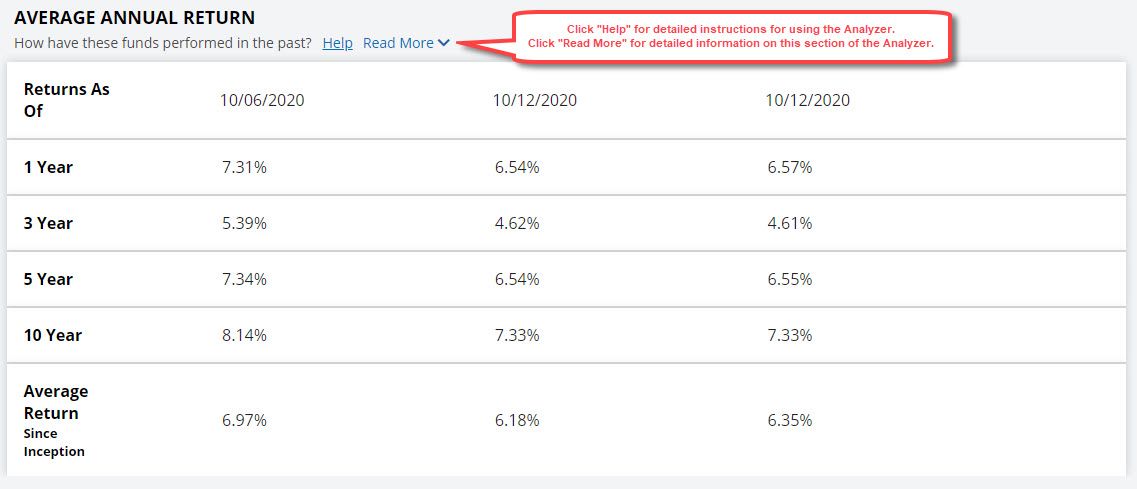
Average Annual Return
The average annual returns, and their as-of dates as reported by Morningstar, are displayed for your selected fund(s).
Morningstar does not adjust total returns for account-level fees such as front-end loads, deferred loads, and redemption fees. In Morningstar's opinion, to give a clear picture of performance, total returns only account for costs that are deducted from fund assets. That is the expense ratio, which includes management fees, administrative fees, 12b-1 fees, and certain other costs.
Click Read More to view detailed information on Morningstar's return data.
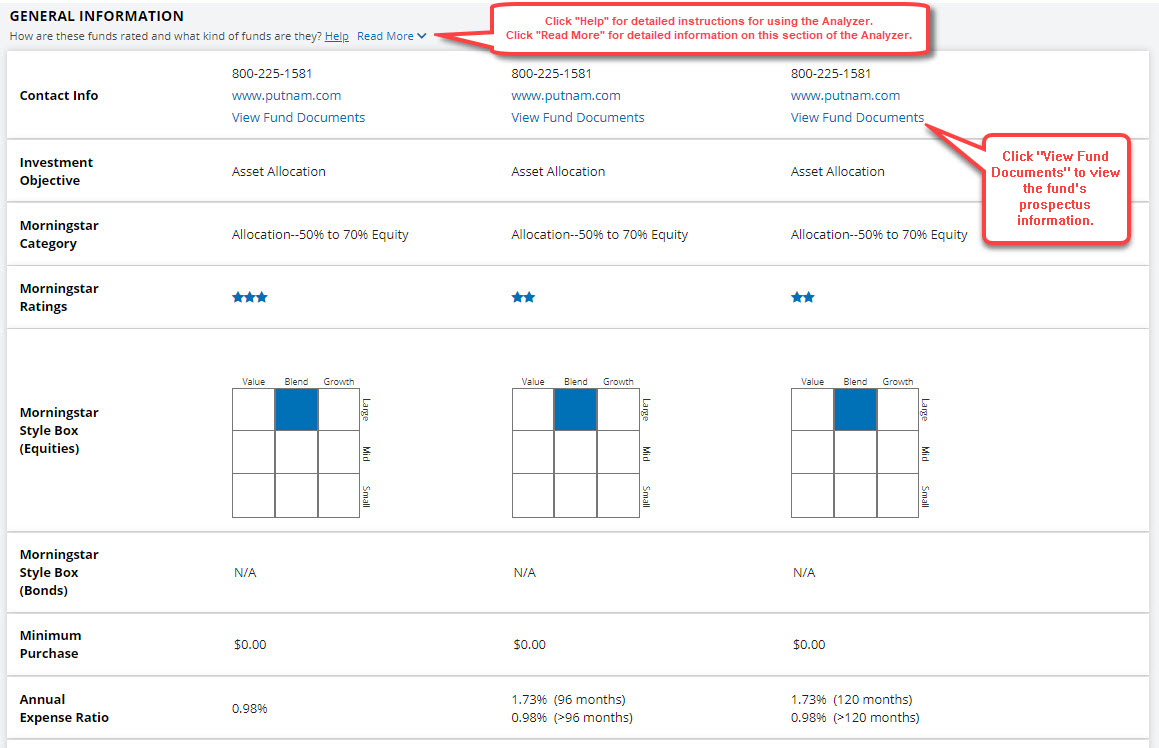
General Information
Displayed for each fund selected are its contact information, investment objective, category, 3-year Morningstar Star Rating, Morningstar Equities and Bonds Style Boxes, minimum purchase amount, annual operating expense, front-load, back-load, redemption fees, and 12b-1 fees. Additionally, the Potential Costs Over Time illustration shows which fees each fund may be subject to over time. For example, it shows when, and if, any potential front-loads, back-loads, redemption fees, and annual operating expense may apply. Click "Read More" to view additional information.
Share the Results of Your Analysis
You can easily share the results of your analyses using the Share function.
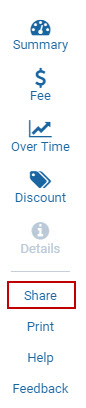
Click Share in the left menu while viewing the Analyzer's results.
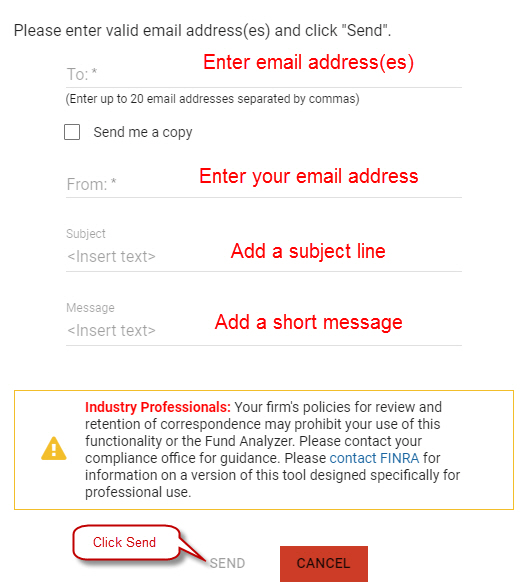
An email form will display. Enter up to 20 email addresses (separated by commas), your email address, a subject line, and a short message.
Click "Send" to send the email. The recipient(s) will receive a message containing a link to the Analyzer. It will display your analysis including any investment parameters entered and advanced options you selected. The link is valid for 90 days.
Printing or Saving Your Analysis
Click the Print icon in the left menu while viewing the Analyzer's results or any fund's detail page.
To optimize the analysis for printing, a new window will open. Your printer's print dialog box then will open automatically. You may print the report or save it as a PDF to your computer.
Once printed or saved, close the printer-friendly version.
Help
Feedback
Using the Advanced Options
Future Contributions | Annual Withdrawals | Existing Assets | Rights of Accumulation | Letters of Intent | Future Rates of Return | Loads, Commissions and CDSCs | Wrap Accounts and Flat Account Fees | Account Aggregation | Trade Cost and Annual Turnover | Ticket Charges
Types of Calculations Available in the Fund Analyzer
How to Configure the Fund Analyzer for Transaction ("Clean") Share Calculations
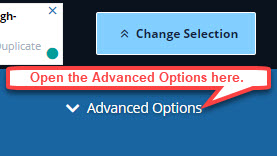
To use the Fund Analyzer's suite of advanced functions, click the Advanced Options link in the upper-right of the report page. This link is not visible until you select your fund(s) and click Analyze to generate the initial report.
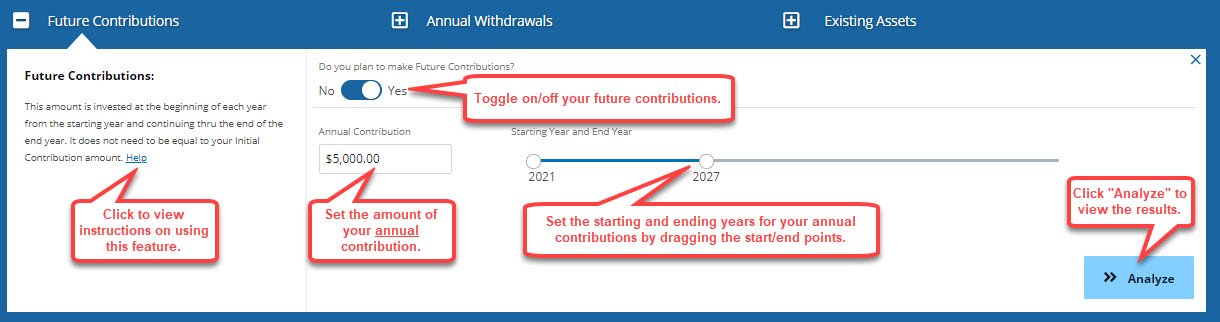
For example, to define a series of contributions, click Advanced Options and then Future Contributions. An entry panel for Future Contributions will open. You can then turn on/off contributions, set the amount of the contributions, and set the time span for which you make them.
Future Contributions
To define a series of future contributions, open the entry panel and toggle on "Do you plan to make Future Contributions?" Enter the annual contribution amount. Then define the starting and ending years for your contributions by dragging the start/end year points as desired. They need not be made in consecutive years. For example, making contributions for 2023 to 2026 is to make four contributions inclusive. They start after the initial one is made, such as in 2021.
Future contributions do not need to equal your initial contribution. They may start as early as the year following your initial contribution or begin years later.
Initial and Future Contributions are made at the beginning of the year. Contributions must end before any withdrawals begin. Error messages will warn you if there is an input conflict in this regard.
Transaction shares: If you define your funds as transaction shares (or "clean shares") by selecting Yes to "Do Trades Create Cost?" in the Trade Cost & Annual Turnover advanced option, contributions will be restricted to year one (i.e., your initial contribution) and year two only. This restriction is necessary to reduce the complexity of the transaction share calculations.
Once your contributions are defined, save them by clicking the Analyze button. They will be used to re-run your analysis. The Future Contributions entry panel will close though you will see a small panel with your entries. Click the pencil icon to edit them. Click the trash can to delete them.

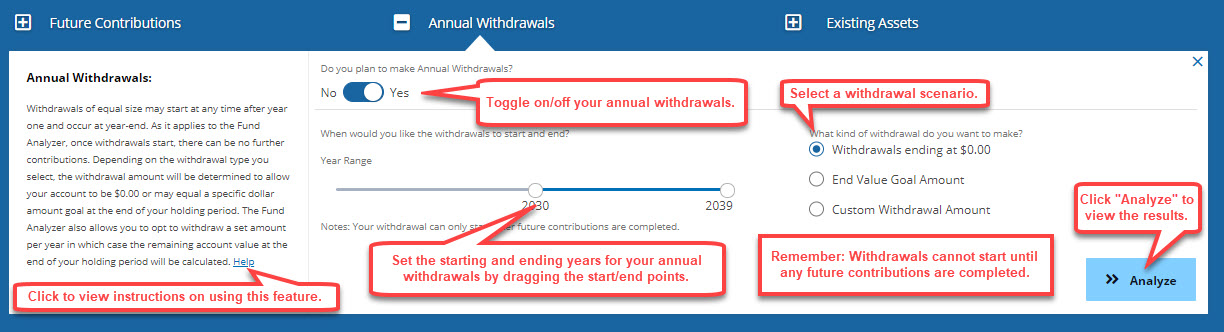
Annual Withdrawals
To define a series of annual withdrawals, open the entry panel and toggle on "Do you plan to make Annual Withdrawals?" Define the starting and ending years for your withdrawals by dragging the start/end year points as desired. Then select one of three types of withdrawal scenarios.
Withdrawals occur at year-end, during the period you specified, after all account-level and product level costs are deducted. They will be of equal size and cannot begin until all contributions have ended. Error messages will warn you if there is an input conflict in this regard.
The Analyzer accommodates three types of withdrawal scenarios:
$0.00 end amount – The Analyzer will calculate the annual withdrawal amount for the years you specify. Your account value will end at $0.00 once your last withdrawal occurs.
End value goal amount – This option lets you define the account value remaining once your withdrawal period ends. For example, you enter $25,000. The Analyzer will calculate the annual withdrawal amount for the years you specify. Your account value be $25,000 once your last withdrawal occurs. This value then will grow at the rate of return you specified.
Custom withdrawal amount – This option lets you define the annual withdrawal amount for the years you specify. For example, you enter $10,000. The Analyzer will withdraw $10,000 annually for the years you specify. Any remaining account value will be determined. If it is less than zero, then your final withdrawal will be adjusted so that the account value is $0. If the amount remaining is positive, then it will then grow at the rate of return you specified.
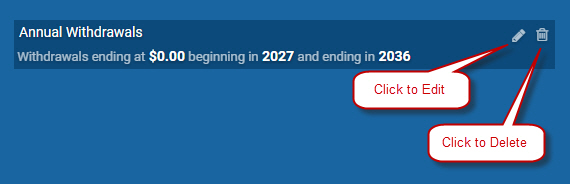
Once your withdrawals are defined, save them by clicking the Analyze button. They will be used to re-run your analysis. The Annual Withdrawals entry panel will close though you will see a small panel with your entries. Click the pencil icon to edit them. Click the trash can to delete them.
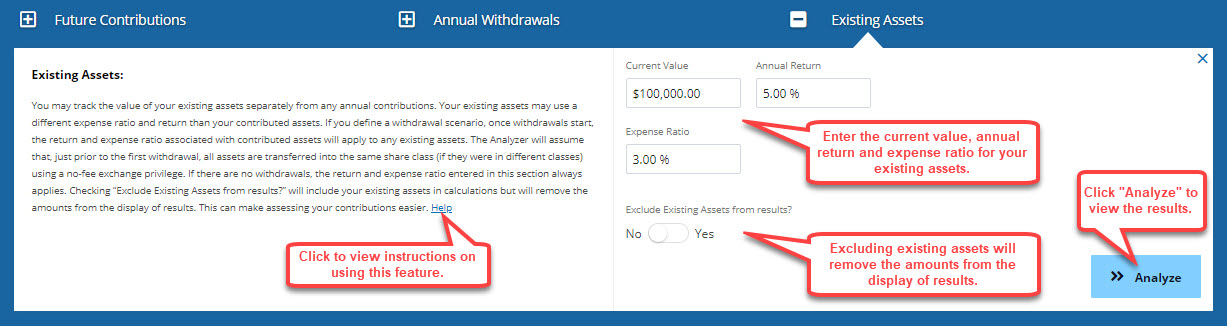
Existing Assets
Existing assets are those you own but are not modeled directly with the Fund Analyzer. They are invested already, for example, in a 401(k), and IRA, brokerage, or advisory account, among other options. You can track their value separately from the contributions you model using the Analyzer. The Analyzer only models new contributions. By considering your existing assets and contributions together, you get a "bigger picture" of your overall portfolio.
Check Yes or No for "Exclude Existing Assets from results?" By checking No, your existing assets will not be included in the displayed results, though they are modeled. By checking Yes, they are included in the displayed results. This ability makes it easier to evaluate the growth of your contributions given other elections that you make.
Existing assets can use a different expense ratio and return than your contributed assets. That is because they are unlikely to be invested identically to your annual contributions. Existing assets, for example, can be invested in bond mutual funds while your new contributions use equity ETFs. The expense ratios and expected returns will differ greatly. You must make those entries. The Analyzer does not populate those fields automatically.
Potentially, existing assets may qualify for rights of accumulation (ROA) purposes. The portion that qualifies must be invested in the same fund family as your contributed assets, but they do not have to use the same share classes. See the ROA section for more information and an example.
If you define a withdrawal scenario, existing assets can be included or excluded from the displayed results. If they are included, then they are part of the withdrawals and the account values and costs.
Once withdrawals start, the return and expense ratio associated with contributed assets will apply to any existing assets. The Analyzer will assume that, just prior to the first withdrawal, all assets are transferred into the same share class (if they were in different share classes) using a no-fee exchange privilege. If there are no withdrawals, the return and expense ratio entered in this section always will apply.
Once your existing assets are defined, save them by clicking the Analyze button. They will be used to re-run your analysis. The Existing Assets entry panel will close though you will see a small panel with your entries. Click the pencil icon to edit them. Click the trash can to delete them.

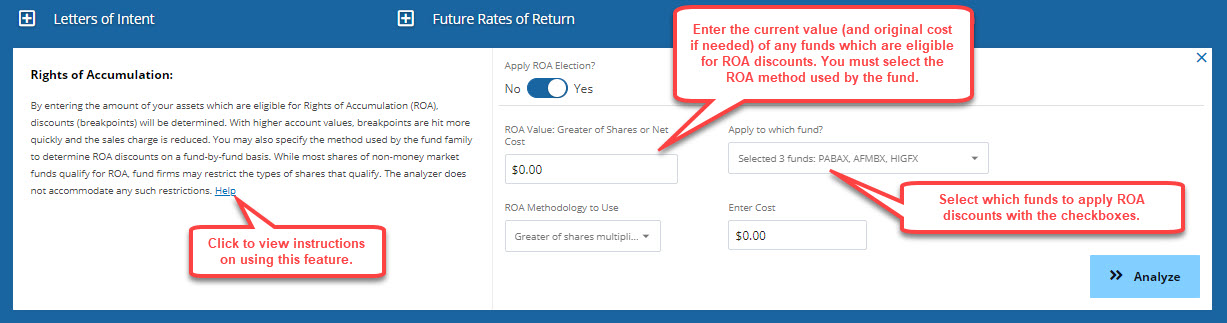
Rights of Accumulation
Rights of accumulation (ROA) is a benefit offered to investors by fund families. It helps to lower the sales charge applicable on certain classes of mutual funds, notably A-shares.
Assets already held at a fund family can be added to the value of newly contributed assets of the same family. These already-held assets are referred to as ROA-qualifying assets. By adding the value of your ROA assets to the value of your contributions, breakpoint discounts will be hit more quickly, thus often lowering a sales charge. While most shares qualify for ROA consideration, only shares with front-end loads benefit from them.
By definition, ROA assets are existing assets, but not necessarily vice versa. Thus, some of your existing assets may qualify for ROA purposes. The portion that qualifies must be invested in the same fund family as your contributed assets, but do not have to use the same funds or share classes. For example, of your $30,000 in existing assets, $22,000 are in mutual fund C-shares from ABC Fund Firm. Your $40,000 of contributed assets will be invested in ABC's Growth Fund A Shares. The $22,000 in ROA assets will be added to the $40,000 to determine the front-end sales charge on the A-shares. With ROA assets considered, the charge is 5.00%. Without them, the charge is 5.75%.
Specify the method used by the fund family to determine how ROA discounts are calculated. Most choices are variants on the higher of current value or original cost. The choices are shown via a pull-down menu. Each fund's ROA Calculation Methodology is found in the Discount Qualification section of the Analyzer. While most shares of non-money market funds qualify for ROA, fund firms may restrict the types of shares that qualify. The Analyzer does not accommodate any such restrictions.
You also must enter the current value of your ROA assets. Depending on the methodology you choose, you may have to enter their original cost. If you do not know it, simply replicate the current value. Likely, that is the value that would be used anyway.
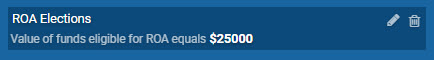
Once your ROA elections are set, save them by clicking the Analyze button. They will be used to re-run your analysis. The Rights of Accumulation entry panel will close though you will see a small panel with your entries. Click the pencil icon to edit them. Click the trash can to delete them.
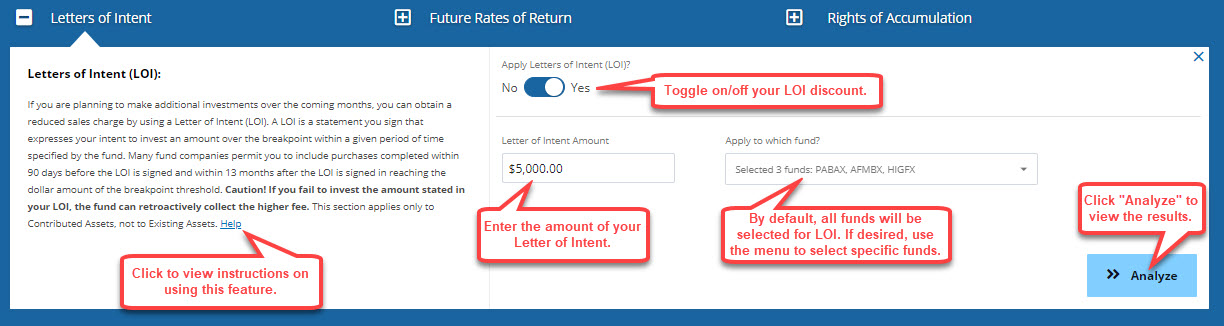
Letters of Intent
A letter of intent (LOI) is a benefit offered to investors by fund families. Like ROA, this benefit helps to lower the sales charge applicable on certain classes of mutual funds, notably A-shares.
An LOI is a statement that you sign. It expresses your intent to make additional purchases (i.e., contributions), within a specific time period, with the fund family. By signing, you may qualify for a reduced sales charge on your current contributions. You are credited in advance for all covered contributions, helping you hit breakpoints more quickly.
LOI is not applicable to no-load shares and those with back-end loads, such as B- and C-shares. However, these shares may help the investor satisfy the LOI purchase requirements. Thus, the A-share load may be reduced, in advance, due to later investments in other share classes.
Many fund companies permit you to include purchases completed within 90 days before the LOI is signed, and within 13 months after the LOI is signed. Collectively, the purchases help you reach the breakpoints. If you fail to invest the amount stated in your LOI, the fund can retroactively collect the higher fee (i.e., sales load) that would have been otherwise applicable.
The Analyzer applies LOI discounts, if any, only if contributions are made for at least two years, which must include one made for year two, specifically. The year one front-end sales charge, if any, will be subject to ROA and LOI rules. Both benefits serve to lower the charge. Only the year-one contribution, however, can benefit from later contributions via an LOI.
At times, the ROA benefit is more favorable — with regard to that year only — than the LOI benefit. For example, under ROA, the load is 3.75%. Under LOI, it is 4.75%. The Analyzer will apply the lower of the sales charges. You must make the elections to apply LOI and ROA. The Analyzer will not do it automatically.
Once your LOI elections are set, save them by clicking the Analyze button. They will be used to re-run your analysis. The LOI entry panel will close though you will see a small panel with your entries. Click the pencil icon to edit them. Click the trash can to delete them.

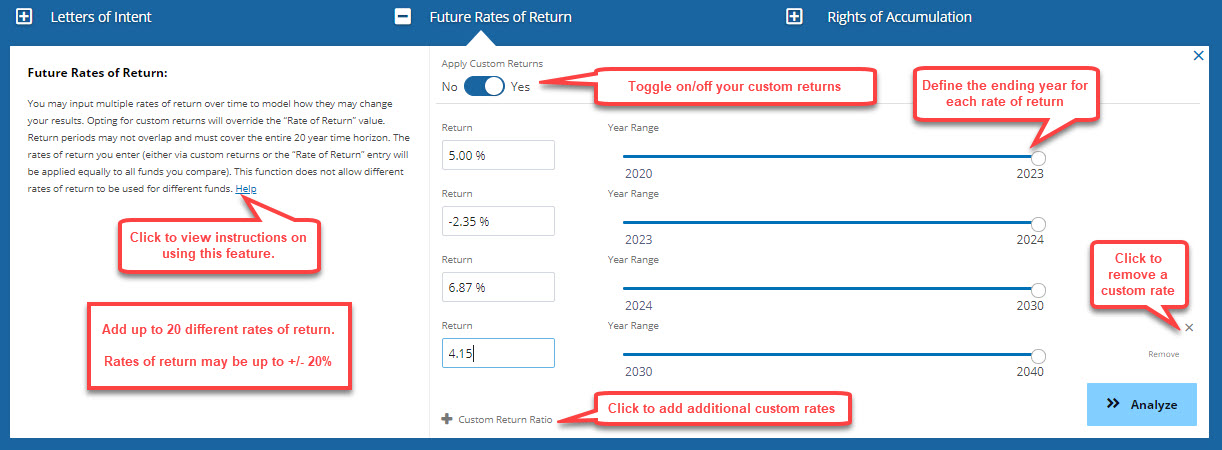
Future Rates of Return
To model scenarios that are more realistic and/or relevant to your situation, you can enter multiple rates of return for future years. As a default, the Analyzer applies a single return (i.e., 5.00%) each year. You can change it to a custom series of returns and define the time each one applies. Use up to 20 different returns between -20% and 20% per year.
By applying custom returns, you override the Rate of Return you entered or the default return (i.e., 5%). In total, the periods for all custom returns must cover the Analyzer's entire 20-year time horizon. For example, you use 4.00% for five years, 9.25% for eight years, and -2.50% for seven years.
The returns you enter — whether custom or the default — apply to all funds equally. This function does not allow different returns for different funds. All funds use the same returns for the same years.
Transaction shares: You can define your funds as transaction shares (or "clean shares"). Do so by selecting Yes to "Do Trades Create Cost?" in the Trade Cost & Annual Turnover advanced option. The Future Rates of Return advanced option will be disabled. This restriction is necessary to reduce the complexity of the transaction share calculations.
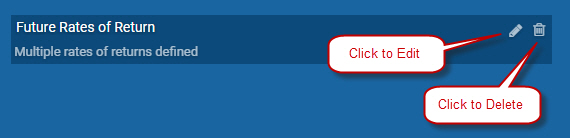
Once your Future Rates of Return entries are set, save them by clicking the Analyze button. They will be used to re-run your analysis. The Future Rates of Return entry panel will close though you will see a small panel with your entries. Click the pencil icon to edit them. Click the trash can to delete them.
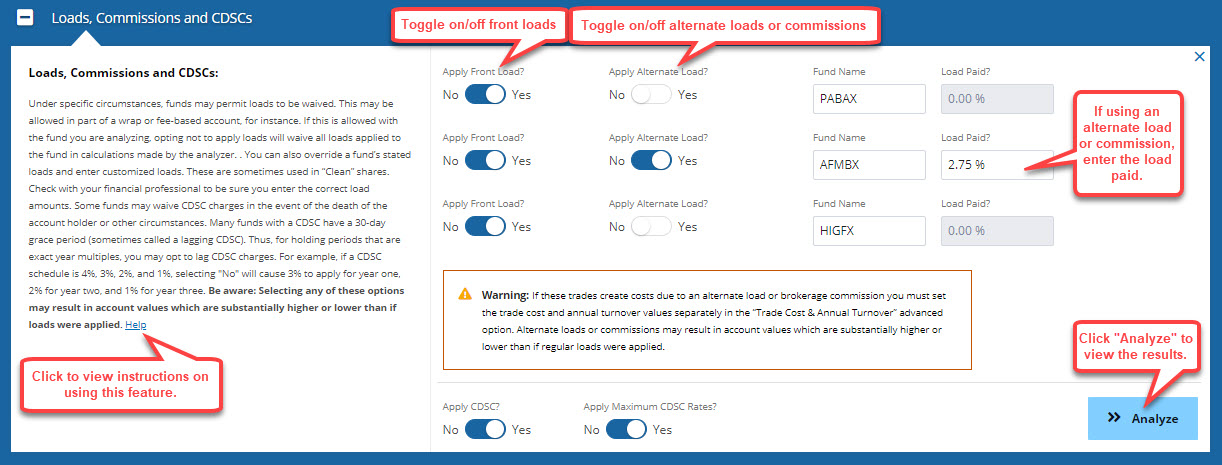
Loads, Commissions and CDSCs
Fund firms and brokerage firms may waive otherwise applicable loads, commissions, or Contingent Deferred Sales Charges (CDSCs). The waivers result from using an advisory account (also called a wrap account), a certain type of brokerage account, an unfortunate circumstance affecting the fund owner, or the owner being an employee of the fund firm or brokerage firm, among other reasons. Waiving these charges, all else equal, leads to higher account values and lower costs.
The Analyzer allows you to waive these charges using the Loads, Commissions, and CDSCs advanced option. To waive them, select No on the Apply Front Load slider. You can apply or waive the charges for each fund individually. Electing a waiver means that any load, commission, and/or CDSC is entirely waived for that fund.
You can also enter a custom load or commission, thus overriding a fund's stated load, if otherwise applicable. This ability is helpful in modeling no-load shares, ETFs, and transaction shares used on a full-service brokerage platform. At the product level, there may be no stated load or commission. At the account-level, however, fees may apply, especially at full-service brokerage firms. Thus, an ETF, no-load share, or so-called "clean share" may be subject to a commission on purchases and/or sales. The charges are assessed by the brokerage firm at the account level. The prospectus, however, may state that there are no loads or CDSCs, but it is referring to product level charges. Enter the trade cost assuming a roundtrip charge. Check with your financial professional to ensure that you enter the correct figures.
For transaction shares (also called "clean shares") and ETFs, and when you switch among load fund firms, there may be post-purchase, account-level transaction costs. You must define them here and in the Trade Cost & Annual Turnover advanced option. These costs may be related to rebalancing, reallocating, and redeploying your portfolio of funds and ETFs.
Some transaction shares may not include traditional load fund benefits such as rights of accumulation, letter of intent, trade aggregation, free exchanges, and others. The A-, B-, and C-shares of the XYZ Growth Fund may offer the benefits. The institutional share class (often with an F, X, or Y prefix) of the same fund does not. The loss of these benefits can create significant extra costs over time. Take care when changing the application of these benefits. The defaults always apply them. So, you will likely elect against applying them.
Most funds waive CDSCs in the event of the death, disability, or divorce of the account holder, and for other reasons. To waive the CDSC for applicable funds, select No on the Apply CDSC slider.
Many funds with a CDSC offer a reverse grace period that serves to reduce the charge. (It may be called a lagging a CDSC.) There are several variants of this grace period. In one case, each year you are credited with holding shares for an entire year if you redeem them during the 12th month of that year. For example, a CDSC schedule is 4%, 3%, 2%, and 1%. If the redemptions are made near each investment year-end, then 3% applies for year one, 2% for year two, and 1% for year three. To lag CDSCs, select No on the Apply Maximum CDSC Rates slider.
Commissions: These payments are transaction-based, not asset-based. The commission rate used by the Analyzer must be entered by the user via the Advanced Options. The rate often is in the 1% to 3% range, though it can be substantially higher or lower. The Analyzer requires that all commission payments be expressed as a percentage.
Note that dollar-based commission payments are common. To model them, the user must convert a dollar-based commission (e.g., $200) to its percentage equivalent (e.g., 1.35%). Dollar-based commission entries, thus, will be estimates. Over time, they may drift from the initial percentage as account value changes. The impact on results will be minimal.
The Analyzer assumes that commissions apply only to buys. It is a one-way charge. No commissions are assessed on redemptions. If that is how they apply for the user's firm, then enter the rate (e.g., 2.00%). In reality, a commission may apply to buys, sells, or both. The user must be familiar with how their firm assesses commissions since every firm's commission schedule is different.
If commissions are assessed only on sells, then enter the rate normally (e.g., 2.00%). Hence, a buy-only or sell-only commission will be treated the same way by the Analyzer: as a one-way charge. The discrepancy will be inconsequential.
If commissions apply two ways (i.e., on buys and sells), then the user may need to adjust the entries and all results will be approximate. If turnover is low (e.g., less than 20% per year which is five or more years, on average), then enter just a one-way rate (e.g., 2.00%). If turnover is high (e.g., more than 20% per year which is less than five years, on average), then enter twice the one-way rate (e.g., 2 * 2.00% = 4.00%). The initial buy, and the turnover that occurs later, will be assessed the proxied two-way commission rate (e.g., 4.00%).
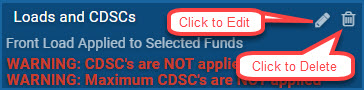
Note: By selecting any of these options, displayed account values and costs may be substantially higher or lower than had the selections not been made. Once your Load, Commission, and CDSC entries are set, save them by clicking the Analyze button. They will be used to re-run your analysis. The Loads, Commissions, and CDSCs entry panel will close though you will see a small panel with your entries. Click the pencil icon to edit them. Click the trash can to delete them.
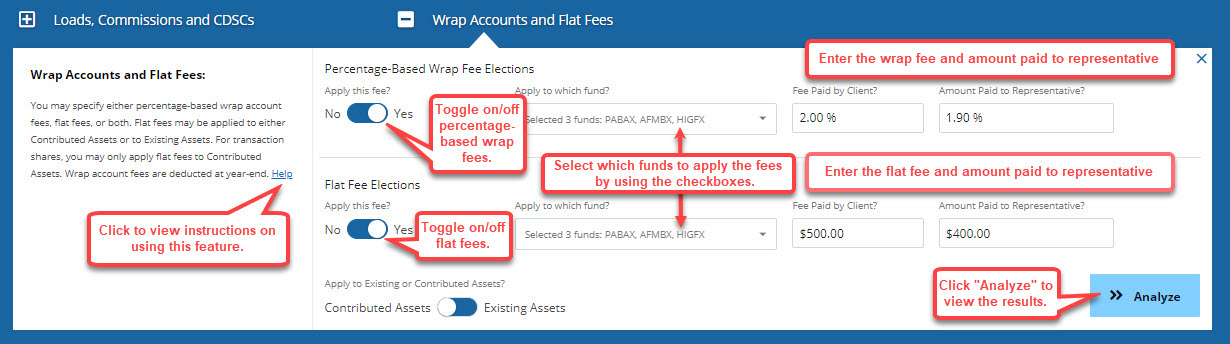
Advisory and Flat Account Fees
The Analyzer distinguishes fees paid by investors from those that are credited as production (i.e., pay) to their financial professional. In many cases, only a portion of what an investor pays is credited to the professional. For example, with certain advisory accounts, the annual client fee may be substantially higher than the amount credited to the advisor as pay. Assume that a client pays a 1.75% annual advisory fee. Their financial advisor is credited with 1.25% of that 1.75% as gross production. Of that 1.25%, the advisor keeps from 40% to 90%, depending on their employer firm. The Analyzer uses the 1.75% figure to determine account values and investor costs. The 1.25% figure is the source of the pay to the advisor.
Advisory Fee: These fees are asset-based, not transaction-based, like commissions or ticket charges. Advisory fees are quoted on an annual percentage basis (e.g., 1.50% per year) and assessed against assets held within an advisory account (also called a wrap account). The Analyzer always applies these fees to your contributed assets. The fee is assessed quarterly and deducted from quarter-end assets in the account. For example, the fee is 1.50%. At each quarter-end, 0.375% is assessed against the account's assets.
The fee that an investor pays (e.g., 1.50%) is not always the same as the amount credited to their financial advisor (e.g., 1.15%). While the two figures often are the same, for some mutual fund wrap accounts and for separately managed accounts (i.e., SMAs), the fee to the investor (i.e., client) may be 0.25% to 0.50% higher than the amount paid to the advisor. In any event, the amount payable to the advisor cannot be higher than the amount paid by the investor (i.e., client). The difference between the figures often goes to the money managers (or fund firms) that run the account's underlying portfolios. To calculate account values and costs, the Analyzer uses the 1.50% account-level figure (per the example).
To each of your fund selections, you may apply a percentage-based advisory fee (also called a wrap fee), dollar-based flat fee, or both. Fees that apply to one fund do not necessarily apply to the others. Enter the fee paid by the client (e.g., 1.50%) and the portion that is paid to the financial professional and credited as pay (e.g., 1.25%). Use the Apply This Fee slider and the pull-down menu to select the funds to which the advisory fee will apply. The same fees apply to each fund selected.
Flat Fee: Flat fees are annual account-level fees that may cover charges such as financial plans, account-level maintenance fees, or proxy for an advisory fee. This fee is assessed each year at the account level and is neither asset-based nor transaction-based. It is quoted in dollar terms (e.g., $500 per year). It may represent annual account maintenance fees (e.g., $50). It may proxy for an asset-based advisory fee (e.g., $1,000 per year). It may represent the cost of an annual financial plan that an advisor provides (e.g., $500). It can also represent all three types of charges. The fee must apply in each year and is not adjustable (in this version of the Analyzer) for increasing asset levels and/or inflation. This fee is charged to the investor. It is applied to end-of-year assets and deducted from the account prior to CDSCs being deducted (if any). If there are withdrawals, the fee is deducted before the withdrawals are made.
Flat fees apply to the scenarios individually by making a Yes/No election. The Analyzer can apply these fees to your Contributed Assets or to Existing Assets. Use the slider to indicate your election. Enter the fee paid by the client (e.g., $500) and the portion that is paid to the financial professional and credited as pay (e.g., $400). Use the Apply This Fee slider and the pull-down menu to select the funds to which the flat fee will apply. The same fees apply to each fund selected.
For transaction share analyses, flat fees only apply to Contributed Assets. Also, once withdrawals begin, the Analyzer automatically ceases all turnover calculations (i.e., commission debits and pay credits). No election is required by the user. These restrictions ease the complexity of the calculations and number of inputs required by the user.
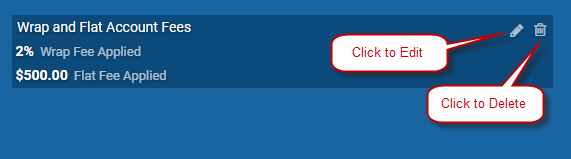
Once your wrap (percentage-based advisory) and flat fee entries are set, save them by clicking the Analyze button. They will be used to re-run your analysis. The Advisory and Flat Fees entry panel will close though you will see a small panel with your entries. Click the pencil icon to edit them. Click the trash can to delete them.
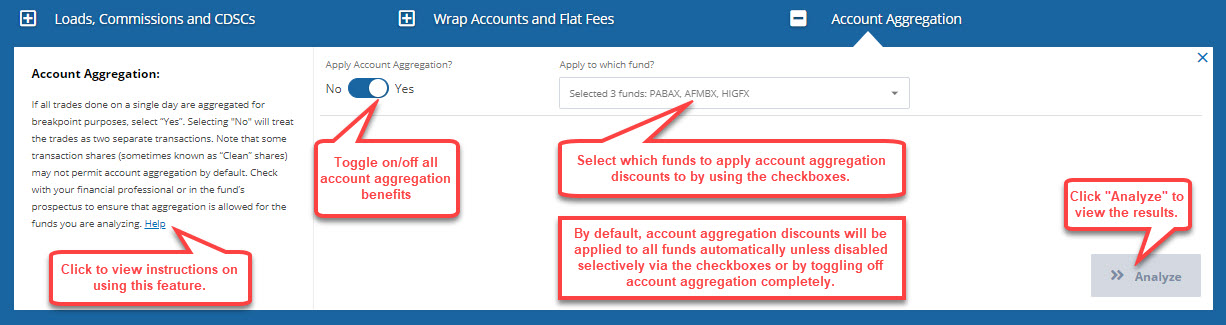
Account Aggregation
Account aggregation (also called trade aggregation) is a benefit offered to investors by fund families. Like ROA and LOI, this benefit helps to lower the sales charge applicable on certain classes of mutual funds, notably A-shares. Similarly, it may help lower the commissions applicable to brokerage transactions.
If certain fund trades in related accounts are done on a single day, often they are aggregated for breakpoint purposes. The fund firm and/or brokerage firm determine which trades qualify. Select Yes or No with the slider to activate or deactivate this benefit.
If you select No, trades will treated as two separate transactions for internal calculation purposes. At times, your total sales charge may be higher because a breakpoint discount no longer applies. For example, the sales load is 5% for a $10,000 trade and 4% for a $20,000 trade. With trade aggregation, two $10,000 trades will be treated as one $20,000 trade. The total sales charge is $800 (i.e., 4% * $20,000). Without aggregation, the total sales charge is $1,000 (i.e., 2 * 5% * $10,000).
Transaction shares do not necessarily provide the account aggregation benefit even if offered with other share classes of the same fund. The loss of this benefit can create significant extra costs over time. Check with your financial professional or in the fund's prospectus to ensure that aggregation is allowed for the shares you are analyzing.
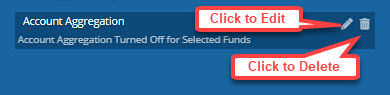
Once your account aggregation entries are set, save them by clicking the Analyze button. They will be used to re-run your analysis. The Account Aggregation Fees entry panel will close though you will see a small panel with your entries. Click the pencil icon to edit them. Click the trash can to delete them.
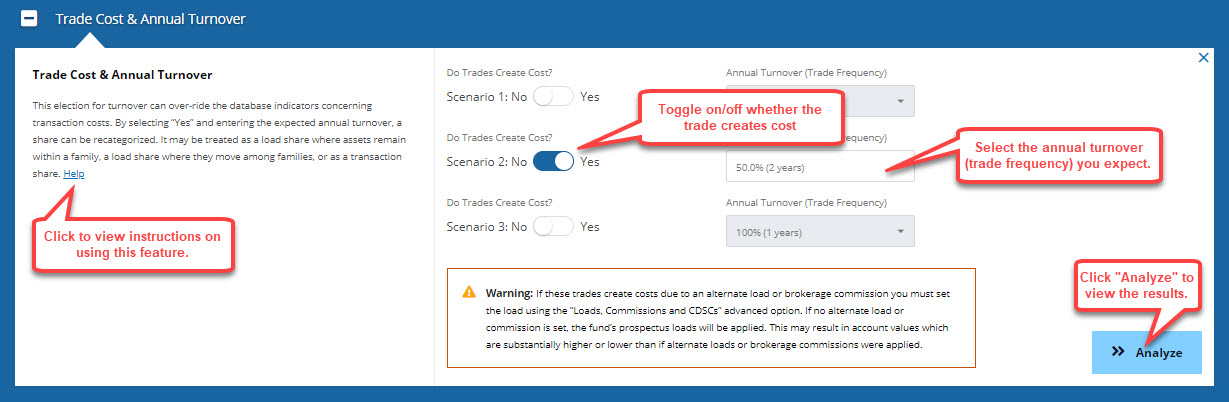
Trade Cost and Annual Turnover
The Analyzer can model the impact of account-level turnover, that you initiate, of the fund and ETF shares you own. This type of turnover is distinguished from that at the portfolio level, which is beyond the investor's control. That portfolio turnover is initiated by the money manager for your funds and involves security-level decisions.
Turnover by the investor often generates a cost when assets move among fund firms and/or across account types. For transaction shares that are held in a full-service brokerage account, a cost may result even if the assets stay within the fund family and brokerage firm.
The costs and rate of turnover must be defined by the user. Doing so allows the Analyzer to model scenarios that are more realistic and/or relevant to your situation.
Using the sliders, indicate if transactions create costs. Then enter the annual turnover for the funds you own using the slider and pull-down menu. For example, 33% turnover means that, on average, all assets turn over (i.e., are bought and sold) every three years. This rate is also called a trade frequency of every three years. The actual charges are entered via the Loads, Commissions, and CDSCs advanced option.
This ability allows you to model turnover within and among fund families. Turnover within a fund family normally does not create a cost. Turnover among families — e.g., selling funds from ABC to buy those from DEF — normally will create a cost. The free exchanges privilege does not apply among families, only within families. The Analyzer automatically calculates any applicable sales charges.
For user ease, you do not define the funds or families that follow the initial selections. We assume that whatever pricing applied originally is used for all calculations beyond year one. Hence, if pricing for ABC funds applies to start then, over time, that same pricing is used in future years. There are no elections for the user to make in this regard.
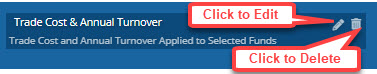
Once your trade cost and annual turnover entries are set, save them by clicking the Analyze button. They will be used to re-run your analysis. The Trade and Annual Turnover entry panel will close though you will see a small panel with your entries. Click the pencil icon to edit them. Click the trash can to delete them.
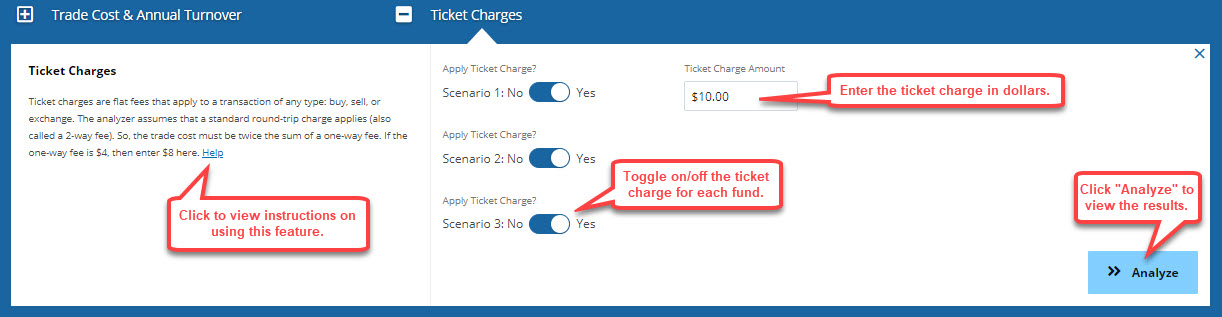
Ticket Charges
Ticket charges are flat fees that apply to a buy, sell, and/or exchange transaction. They are also called transaction fees, processing fees, or similar. They are used to pay for the small fees associated with processing and bookkeeping a trade. Custodian banks, exchanges, and/or clearing firms are part of all trades. Ticket charges help to offset those fees. They are borne originally by the brokerage firm and then, ultimately, by the investor. Ticket charges differ from commissions. They are not based on the trade amount nor are they credited as pay to the financial professional. From a math perspective, they operate like a commission in that they are deducted from the trade amount.
The Analyzer assumes that a standard roundtrip charge applies (also called a 2-way fee). The Analyzer entry, therefore, must be twice the sum of a one-way fee. If a one-way fee is $4, then enter $8 here. Thus, the charge is $4 on the buy and $4 on the sell, totaling $8 for the roundtrip. If you know that ticket charges apply just one way, then enter half of that fee here. (For example, enter $2 if only a $4 one-way fee applies.) The Analyzer will double it, thus generating a result that is still extremely accurate. A one-way fee applies to start. The Analyzer divides the entry by two in that case automatically. For the final redemption, a one-way fee applies. The Analyzer again automatically divides the entry by two. For all exchanges and trades after the initial investment, and before final redemption, the full two-way fee applies. No part of the ticket charge is credited to the advisor as pay. It is simply a cost to the investor.
The Analyzer assumes that scenarios start with cash. No ticket charges apply to the sell side. One applies to the initial contribution (and in year two, if any). To ease the complexity of the calculations, and limit the number of user inputs, these fees do not apply to contributions made after year two even if several future contributions are made.
Once your ticket charge entries are set, save them by clicking the Analyze button. They will be used to re-run your analysis. The Ticket Charges entry panel will close though you will see a small panel with your entries. Click the pencil icon to edit them. Click the trash can to delete them.

How to Configure the Fund Analyzer for Transaction (e.g., "Clean") Share Calculations
The Fund Analyzer can evaluate trades for traditional mutual fund share classes, ETF, ETN and money market shares, and for transaction (or "clean") mutual fund shares. "Transaction Shares" is a term that applies to any share of any fund whereby any transaction generates a sales load or commission post the initial investment. Traditional load shares — A, B, or C — can be considered transaction shares when, for example, assets are traded among fund firms. In such cases, the free exchange privilege does not apply and thus, a new load applies. Transaction shares are similar to traditional no-load shares except that, in some cases, a brokerage firm may apply a commission to transactions. If your trades generate a commission, work with your financial professional to estimate your trading frequency (also called annual turnover) for the fund. This frequency may be related to how often you rebalance, reallocate, or redeploy assets in your portfolio.
You may configure the Fund Analyzer to apply a custom load (referred to as the "Commission Rate"). When a transaction share is configured with a custom commission rate (or load), the Analyzer will turn off the fund's front- and back-end loads (as defined in the prospectus) and use the load or commission assessed by the brokerage firm (via the Loads, Commissions and CDSCs advanced option). In some cases, you may elect to use the fund's existing prospectus loads instead of a custom load. This election can also be turned on or off via the Loads, Commissions and CDSCs advanced option.
To configure the Fund Analyzer for transaction (e.g., "clean") share calculations, define the following advanced options appropriately:
- Select "Yes" for the scenarios (e.g., funds) that are transaction shares (required).
- Select the desired annual turnover (i.e., trade frequency) for any transaction shares (required).
- Click "Analyze".
- If these trades create costs due to an alternate load or brokerage commission, then you must set the load or commission using the "Loads, Commissions and CDSCs" advanced option. If no alternate load or commission is set, the fund's prospectus loads will be applied. This may result in account values that are substantially higher or lower than if alternate loads or brokerage commissions were applied.
- Select "Yes" for Apply Alternate Load (required if a custom commission is used)
- Enter the load paid as a percentage value (required if a custom commission is used)
- Click "Analyze".
- NOTE: If prospectus-based loads are used, select only "Yes" for "Apply Front Load." Do not make other elections. Prospectus loads will apply automatically.
- Some fund firms and brokerage firms may not offer ROA benefits for transaction shares. Check with your financial professional to determine if ROA benefits exist for the transaction share(s) you are analyzing. If you configured ROA benefits previously, via the advanced options, you may need to turn off ROA if the benefit does not exist for the funds you are reviewing. To turn off ROA benefits for a specific transaction share:
- In the ROA advanced option, uncheck the transaction share(s) that are not eligible for ROA benefits in the "Apply to which fund" dropdown menu.
- You may leave ROA checked for funds that allow the benefit. It will be applied in the analysis.
- Click "Analyze".
- Some fund firms and brokerage firms may not offer LOI benefits for transaction shares. Check with your financial professional to determine if LOI benefits exist for the transaction share(s) you are analyzing. If you configured LOI benefits previously, via the advanced options, you may need to turn off LOI if the benefit does not exist for the funds you are reviewing. To turn off LOI benefits for a specific transaction share, do the following:
- In the LOI advanced option, uncheck the transaction share(s) that are not eligible for LOI benefits in the "Apply to which fund" dropdown menu.
- You may leave LOI checked for funds that allow it. The benefit will be applied in the analysis.
- Click "Analyze".
- NOTE: If you apply LOI benefits, remember to make at least a second contribution using the Future Contributions advanced option. LOI benefits will be applied to contributions made in years one and two.
- Click "Analyze".
- Some fund firms or brokerage firms may not permit account aggregation benefits for transaction shares. Check with your financial professional to determine if account aggregation benefits exist for the transaction share(s) you are analyzing. Account aggregation benefits are automatically turned on for all funds unless specifically turned off via the advanced options. You may need to turn off account aggregation if the benefit does not exist for the funds you are reviewing. To turn off account aggregation benefits for a specific transaction share, do the following:
- In the Account Aggregation advanced option, uncheck the transaction share(s) that are not eligible for account aggregation benefits in the "Apply to which fund" dropdown menu.
- You may leave funds that allow account aggregation checked and the benefit will be applied in the analysis.
- Click "Analyze"