Market Data
FINRA collects certain market data as part of its role in overseeing trading and providing transparency services. Following are select tables drawn from that data.
Table of Contents
- Table 3.1 National Market Systems (NMS) Stocks Trading Summary, 2015—2019
- Table 3.2 National Market Systems (NMS) Stocks Trading by Venue Type, 2017—2019
- Figure 3.1 Monthly National Market Systems (NMS) Stocks Trading by Venue Type (January 2, 2020 − June 30, 2020)
- Figure 3.2 Monthly National Market Systems (NMS) Stocks Trading During Non-Exchange Hours (January 2, 2020 − May 29, 2020)
- Table 3.3 Order Audit Trail System (OATS) Activity―Total OATS Events, 2015—2019
- Table 3.4 Order Audit Trail System (OATS) Activity―Daily Average OATS Events, 2015—2019
- Table 3.5 OTC Equities Market Statistics, 2015—2019
- Figure 3.3 Monthly OTC Equities Trading by Venue Type (January 2, 2020 − June 30, 2020)
- Table 3.6 TRACE Reported Fixed Income Activity by Product Type and Venue Type, 2017—2019
- Figure 3.4 Monthly TRACE Reported Fixed Income Activity By Product Type and Venue Type (January 2, 2020 − June 30, 2020)
Table 3.1 National Market Systems (NMS) Stocks Trading Summary, 2015—2019
| Year | Total Consolidated Volume | Total OTC1 | Percent OTC |
| 2015 | 1,741,532,712,604 | 615,827,618,345 | 35.4 |
| 2016 | 1,848,725,192,622 | 678,857,487,044 | 36.7 |
| 2017 | 1,642,696,484,455 | 616,183,840,401 | 37.5 |
| 2018 | 1,841,855,556,392 | 668,455,710,212 | 36.3 |
| 2019 | 1,771,096,807,512 | 659,344,146,179 | 37.2 |
Source: UTP Trade Data Feed and Consolidated Tape System. Data as of June 5, 2020.
1OTC includes all FINRA facilities (the FINRA/Nasdaq TRF, the FINRA/NYSE TRF and the FINRA Alternative Display Facility). Differences in historical series reflect changes in underlying data over time.
Table 3.2 National Market Systems (NMS) Stocks Trading by Venue Type, 2017—2019
| 2017 | 2018 | 2019 | ||
| Avg. Daily Transactions |
||||
| Exchange | 23,753,772 | 28,495,951 | 28,318,018 | |
| Alternative Trading Systems | 4,092,067 | 4,467,009 | 4,421,323 | |
| Non-Alternative Trading Systems OTC | 2,981,842 | 3,647,186 | 3,638,728 | |
| Total | 30,827,681 | 36,610,146 | 36,378,069 | |
| Avg. Daily Volume (in $ billions) |
||||
| Exchange | 176.0 | 235.4 | 209.1 | |
| Alternative Trading Systems | 36.3 | 43.9 | 39.8 | |
| Non-Alternative Trading Systems OTC | 59.8 | 79.3 | 74.3 | |
| Total | 272.1 | 358.7 | 323.2 | |
Source: Financial Industry Regulatory Authority. Data as of June 26, 2020.
Figure 3.1 Monthly National Market Systems (NMS) Stocks Trading by Venue Type
(January 2, 2020 − May 29, 2020; Percent of Total)
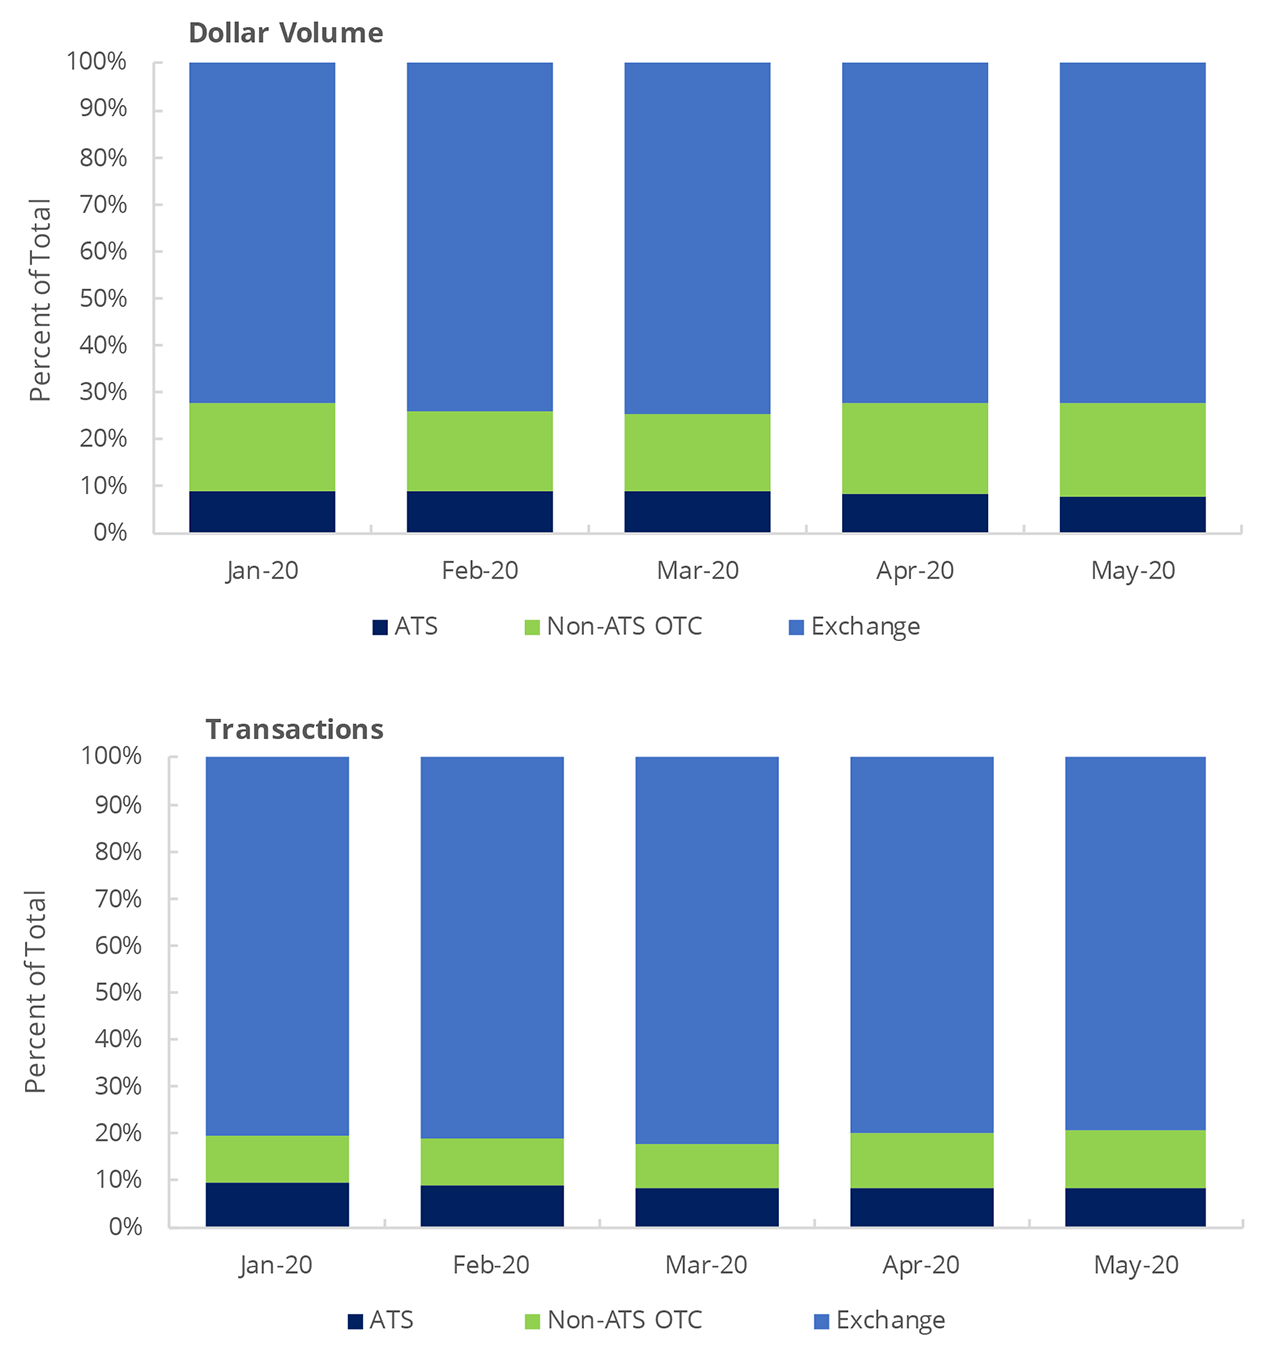
Source: Financial Industry Regulatory Authority. Data as of July 1, 2020.
Figure 3.2 Monthly National Market Systems (NMS) Stocks Trading During Non-Exchange Hours
(January 2, 2020 − May 29, 2020; Percent of Total NMS Trading)
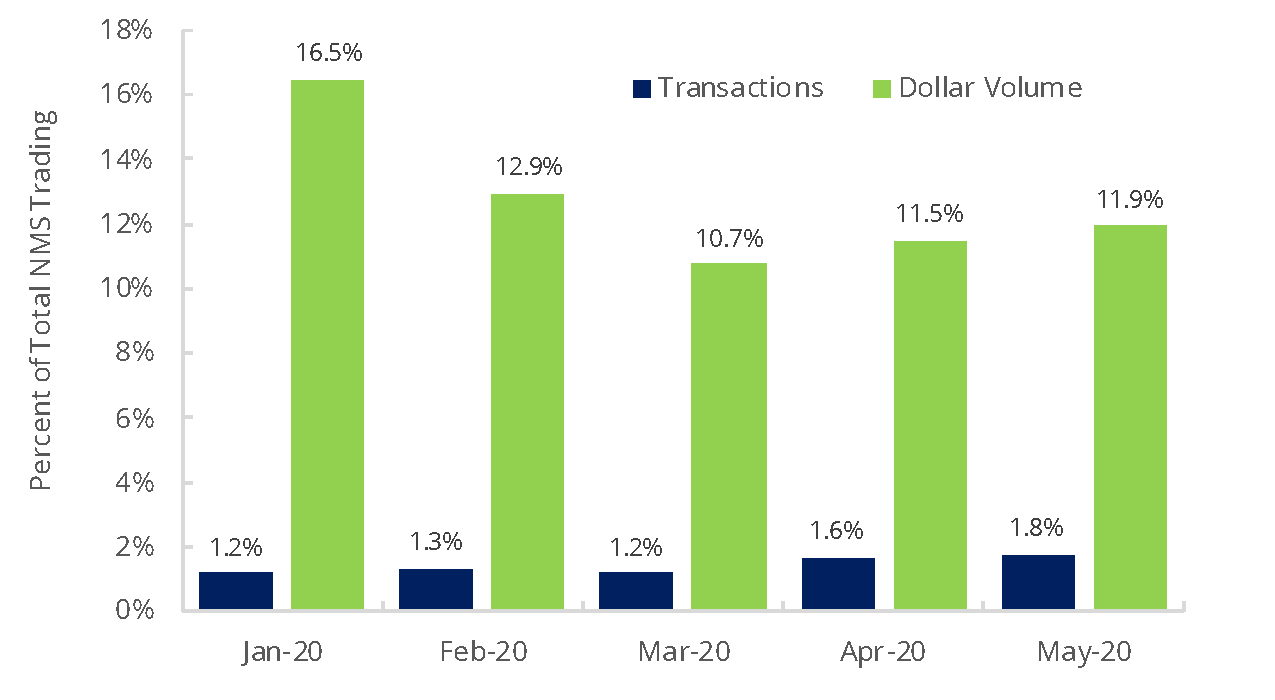
Source: Financial Industry Regulatory Authority. Data as of July 1, 2020.
Table 3.3 Order Audit Trail System (OATS) Activity―Total OATS Events, 2015—20191
| Year | OATS Messages2 | Trade Executions | Number of Shares | Value of Executions ($) |
| 2015 | 753,589,404,714 | 3,083,950,634 | 3,066,698,357,202 | $36,471,141,990,007 |
| 2016 | 727,812,241,098 | 3,961,320,427 | 3,656,985,412,829 | $42,781,770,202,084 |
| 2017 | 531,866,067,552 | 3,527,221,666 | 6,525,698,297,889 | $42,078,647,880,622 |
| 2018 | 729,720,486,018 | 3,973,693,014 | 5,725,806,866,105 | $52,733,733,403,793 |
| 2019 | 709,261,663,217 | 3,981,521,453 | 4,418,448,611,423 | $50,295,154,729,577 |
Source: Financial Industry Regulatory Authority. Data as of May 30, 2020.
1OATS events are aggregated using the date on which they were processed.
2OATS messages include orders, order cancellations, order modifications, new order routes and trade executions.
Table 3.4 Order Audit Trail System (OATS) Activity―Daily Average OATS Events, 2015—20191
| Year | Number of Business Days |
OATS Messages2 | Trade Executions | Number of Sales | Value of Executions ($) |
| 2015 | 252 | 2,990,434,146 | 12,237,899 | 12,169,437,925 | $144,726,753,929 |
| 2016 | 252 | 2,888,143,814 | 15,719,526 | 14,511,846,876 | $169,768,929,373 |
| 2017 | 251 | 2,118,988,317 | 14,052,676 | 25,998,798,000 | $167,644,015,461 |
| 2018 | 252 | 2,895,716,214 | 15,768,623 | 22,721,455,818 | $209,260,846,840 |
| 2019 | 252 | 2,814,530,410 | 15,799,688 | 17,533,526,236 | $199,583,947,340 |
Source: Financial Industry Regulatory Authority. Data as of May 30, 2020.
1OATS events are aggregated using the date on which they were processed.
2OATS messages include orders, order cancellations, order modifications, new order routes and trade executions.
Table 3.5 OTC Equities Market Statistics, 2015—20191
| Year | Average Daily OTC Equities Share Volume |
Average Daily OTC Equities Dollar Volume ($) |
Average Daily OTC Equities Transactions |
| 2015 | 5,683,043,047 | $959,847,789 | 108,523 |
| 2016 | 4,982,665,580 | $939,131,734 | 122,877 |
| 2017 | 11,153,543,340 | $1,145,674,537 | 163,211 |
| 2018 | 8,588,236,117 | $1,511,620,564 | 209,107 |
| 2019 | 6,027,099,196 | $1,326,702,184 | 180,380 |
Source: FINRA OTCE Market Statistics. Data as of June 1, 2020.
1Differences in historical series reflect changes in underlying data over time.
Figure 3.3 Monthly OTC Equities Trading by Venue Type
(January 2, 2020 − June 30, 2020)
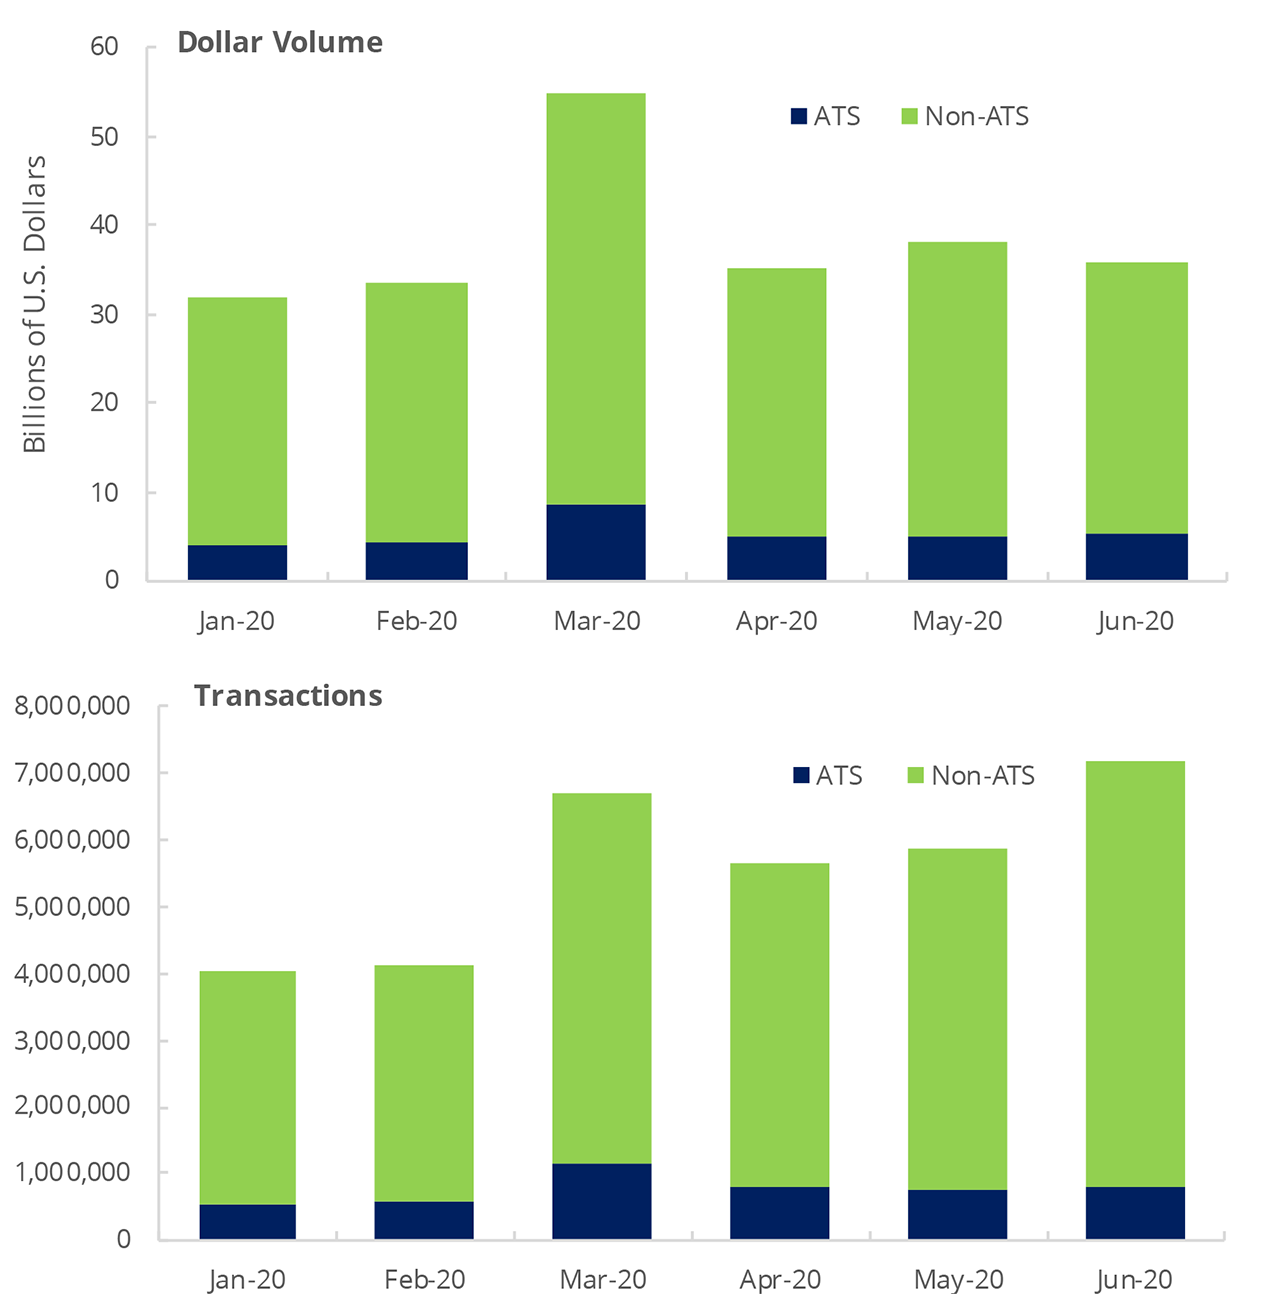
Source: Financial Industry Regulatory Authority. Data as of July 1, 2020.
Table 3.6 TRACE Reported Fixed Income Activity by Product Type and Venue Type, 2017—20191
| Corporate and Agency | 2017 | 2018 | 2019 | |
| Avg. Daily Transactions |
||||
| Alternative Trading Systems | 11,671 | 13,440 | 13,884 | |
| OTC | 46,774 | 51,154 | 55,324 | |
| Total | 58,445 | 64,594 | 69,208 | |
| Avg. Daily Volume (in $ billions) |
||||
| Alternative Trading Systems | 1.6 | 1.7 | 2.1 | |
| OTC | 34.8 | 34.5 | 37.7 | |
| Total | 36.4 | 36.2 | 39.8 | |
| Securitized Products | 2017 | 2018 | 2019 | |
| Avg. Daily Transactions |
||||
| Alternative Trading Systems | 3,225 | 3,511 | 4,744 | |
| OTC | 9,741 | 9,361 | 9,508 | |
| Total | 12,966 | 12,872 | 14,252 | |
| Avg. Daily Volume (in $ billions) |
||||
| Alternative Trading Systems | 40.6 | 46.2 | 69.0 | |
| OTC | 187.8 | 192.1 | 198.8 | |
| Total | 228.4 | 238.3 | 267.8 | |
Source: Financial Industry Regulatory Authority. Data as of June 26, 2020.
1The Trade Reporting and Compliance Engine (TRACE) facilitates the mandatory reporting of over-the-counter secondary market transactions in eligible fixed income securities. Differences in historical series reflect changes in underlying data.
Figure 3.4 TRACE Reported Fixed Income Monthly Summary Activity By Product Type and Venue Type1
(January 2, 2020 − June 30, 2020)
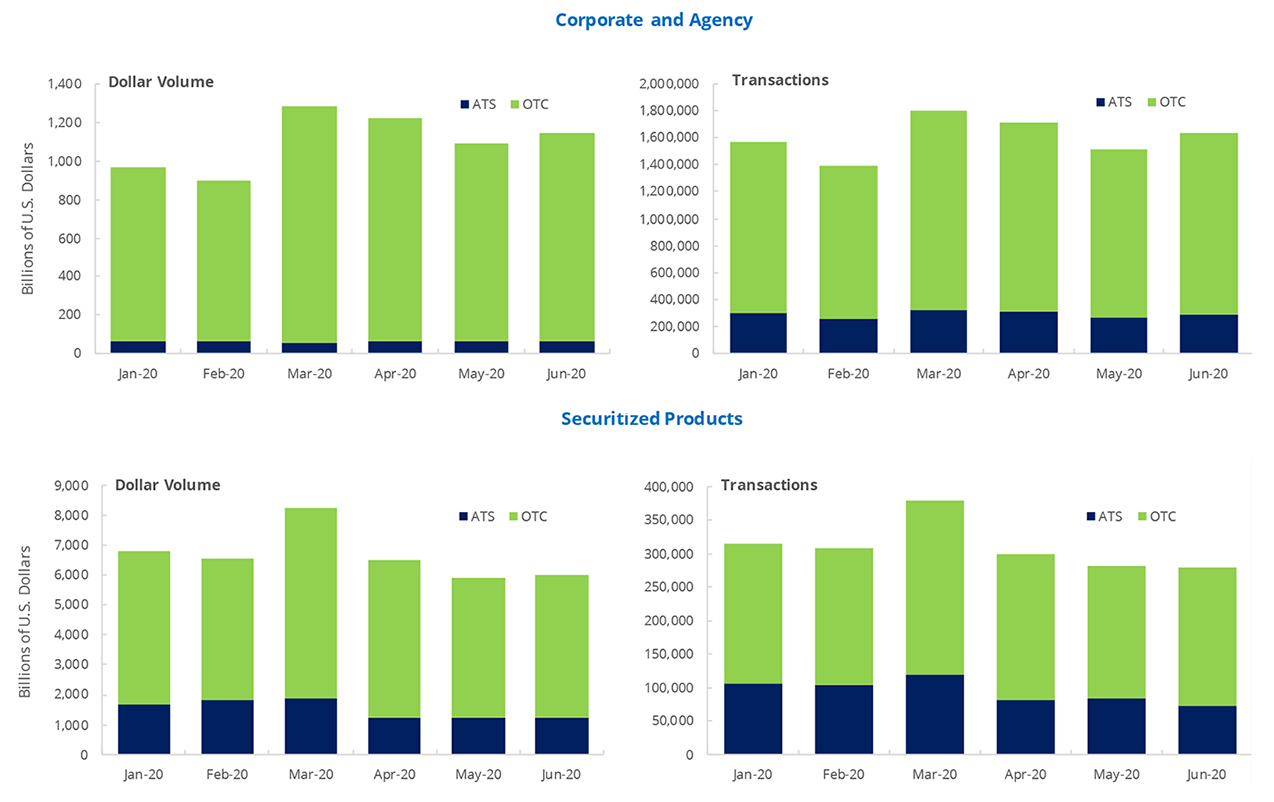
Source: Financial Industry Regulatory Authority. Data as of July 1, 2020.
1The Trade Reporting and Compliance Engine (TRACE) facilitates the mandatory reporting of over-the-counter secondary market transactions in eligible fixed income securities.