
CAT - TRF/ORF Trade Data Consistency Report Card
Overview
This guide explains how to use FINRA's Trade Data Consistency Interactive Report Card to identify and investigate discrepancies between your firm's CAT and TRF/ORF trade records.
To facilitate price discovery and enable regulatory oversight, market participants and exchanges are required to report information regarding transactions in National Market System (NMS) equity securities to a Security Information Processor (SIP) that publicly disseminates price information via the Consolidated Tape. For NMS equity security transactions that do not occur on an NMS exchange, one or both parties to the transaction are required to report the necessary details to a Trade Reporting Facility (TRF). Additionally, market participants executing transactions in certain eligible non-NMS or Over-The- Counter (OTC) equity securities must report those transactions to FINRA’s OTC Reporting Facility (ORF). Separately, market participants are required to report order lifecycle information for both NMS and OTC equity securities, including transaction information, to the Consolidated Audit Trail (CAT) (See FINRA CAT FAQ B11 regarding in-scope products). As they represent the same underlying transaction, firms should report the relevant details identically to a reporting facility (TRF/ORF) and CAT.
FINRA monitors its members’ compliance with equity trade reporting obligations, including the accuracy and consistency of transaction data reported to TRF, ORF, and CAT. Consistency between these data sources is essential to FINRA’s regulatory program. TRF/ORF and CAT records are intended to reflect the actual details of a transaction. Where these records differ, only one version of the transaction is accurate and FINRA is unable to determine which description of the transaction to rely upon to ensure investor protection and market integrity.
The Trade Data Consistency Interactive Report Card facilitates member visibility into instances where, after the CAT correction period ends and the vast majority of TRF/ORF records are final, FINRA is unable to match transactions between the two audit trail systems, as well as instances where the reported price and/or volume of a transaction differs.
How It Works
Each day, on an approximately Trade Date (T) plus six business days (T+6) basis, the Trade Data Consistency Interactive Report Card compares CAT transaction and TRF/ORF information for linkages and discrepancies in material terms (e.g., price, volume).
The Trade Data Consistency Interactive Report Card attempts to link and evaluate published TRF/ORF trade reports with associated CAT trade events. Importantly, this linkage evaluation occurs after the CAT unlinked error feedback and correction period (T+3 at 8:00am ET) and – for TRF/ORF records – at T+5, by which point market participants have reported a significant portion of the late reported and corrected records for a given trade date. Specifically, the Interactive Report Card compares TRF and ORF records against the relevant CAT Industry Member Order Trade events (MEOTs) using a combination of shared values that uniquely identify a transaction (a Linkage Key). When the Linkage Key values match, the TRF/ORF record and MEOT record are deemed “linked.” If the Interactive Report Card is unable to link the TRF/ORF record with an MEOT record, it identifies whichever event exists as an “unlinked” instance.
Once linked, the Interactive Report Card compares the reported price and volume within the TRF/ORF record and the MEOT record. When those terms are not identical, the Interactive Report Card generates an “instance” and identifies which type of inconsistency it is observing (i.e., price, volume).
An example of a Quantity Mismatch instance the Interactive Report Card would identify is as follows:
- On July 6, 2026, broker-dealer ABC Capital (MPID ABCC) received an order to sell 100 shares of the NMS security XYZ with a limit price of $15.50 routed to the firm by another broker-dealer, DEF Markets (MPID DEFM).
- ABCC executed the order by buying 100 shares as Principal from DEFM at a price of $15.50 per share.
- As the transaction occurred over-the-counter rather than on a registered stock exchange, ABCC (the executing party) submitted a trade report to a TRF immediately after execution.
- The trade report to the TRF listed a volume of 100 shares and a price of $15.50 for the transaction with ABCC as the Executing MPID on the buy side, and DEFM as the Contra MPID.
- On July 7, 2026, ABCC reported its portion of the order lifecycle to CAT.
- ABCC reported the MEOT event with a quantity of 1,000 shares and a price of $15.50.
- On T+5 (July 15, 2026), the Interactive Report Card evaluated all TRF and ORF trade reports for July 6, 2026, and, using the Linkage Key, links the TRF report with the corresponding MEOT representing the same transaction.
- After linking the relevant TRF and MEOT records, the Interactive Report Card evaluated the material terms of each record. The Interactive Report Card identified a difference between the TRF record, which stated that the transaction was for 100 shares of XYZ, and the MEOT record, which stated that the transaction was for 1,000 shares.
- On T+6, (July 16, 2026) The Interactive Report Card generates a Quantity Mismatch instance (TRF – 100 shares v. MEOT – 1,000 shares) for this transaction on July 7, 2026, attributed to the reporting firm (ABCC).
Features and Tools
As outlined in detail below, this Interactive Report Card has the following functionality:
- Dashboard & Trade Details
- Peer Firms Information
- Self-Set Notifications
- Export to CSV
- Export File Layouts
Control Panel

When you enter the Trade Data Consistency Interactive Report Card, the top banner presents you with a selectable Begin Date and End Date. The default Begin Date is the first day of the previous full month and the default End Date is the current date. For example, a member accessing the Interactive Report Card on Thursday, January 15, 2026, would see a default Begin Date of December 1, 2025, and a default End Date of January 15, 2026. Members can adjust the date range to span across longer or shorter custom date ranges; this Interactive Report Card has data available back to January 1, 2025. The Begin and End Date dynamically drive the contents of interactive visualizations in the remainder of the Interactive Report Card.
Submitter Selection
The Dashboard tab is the starting point for accessing the rest of the Interactive Report Card functionality. At the top of the Dashboard tab, the Submitter selection table identifies the CAT Submitters (i.e., submitter name and CRD number) that have reported trades to CAT between the Begin and End Date in the Control Panel. For trades submitted by a non-FINRA Member, the submitter name will read as “Non-Broker Dealer,” while the CRD will be populated. The Total Trade column reflects the number of trades reported to CAT between the Begin and End date in the control panel.

By default, the Unlinked Trade, Quantity Mismatch, and Price Mismatch visualizations in the Dashboard tab display trades from all submitters. If you have more than one Submitter, clicking on an individual Submitter narrows the visualizations in the Dashboard tab and associated Trade Details tabs to only the selected Submitter.
Total Trade Count: Link Status
Below the Submitter selection table, the Total Trade Count: Link Status visualization displays the link status of each trade for each day of the period selected. Specifically, each bar of the chart represents the total number of trades for a specific day, with the link status (i.e., Linked, Unlinked, Null, Appended) of those trades visualized through color coding within the bar. Hovering over the bar reveals the detailed count of each link status for that day. For example, as visualized below on January 14, 2026, the total trade count for the selected Submitter was 8,722, with 4,326 linked trades, 1,951 unlinked trades, 641 appended trades and 1,804 null link trades:
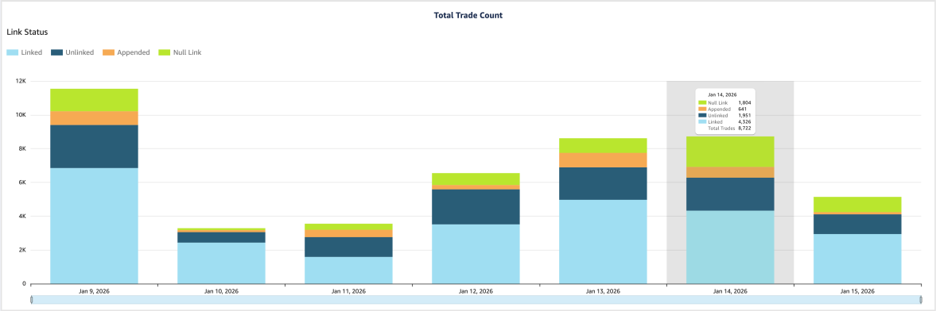
Link status is a code derived by the Consolidated Audit Trail linkage process which is intended to identify if an event is linked to the expected event.
Link status definitions are as follows:
| Linked Status | Bar Color | Definition |
|---|---|---|
| Linked | Light Blue | Event is linked. |
| Unlinked | Dark Blue | Event is unlinked. |
| Appended | Orange | Event received outside processing window and appended to lifecycle. |
| Null Link | Neon Green | Linkage is not applicable. |
Unlinked Trade: Count and Rate Visualizations
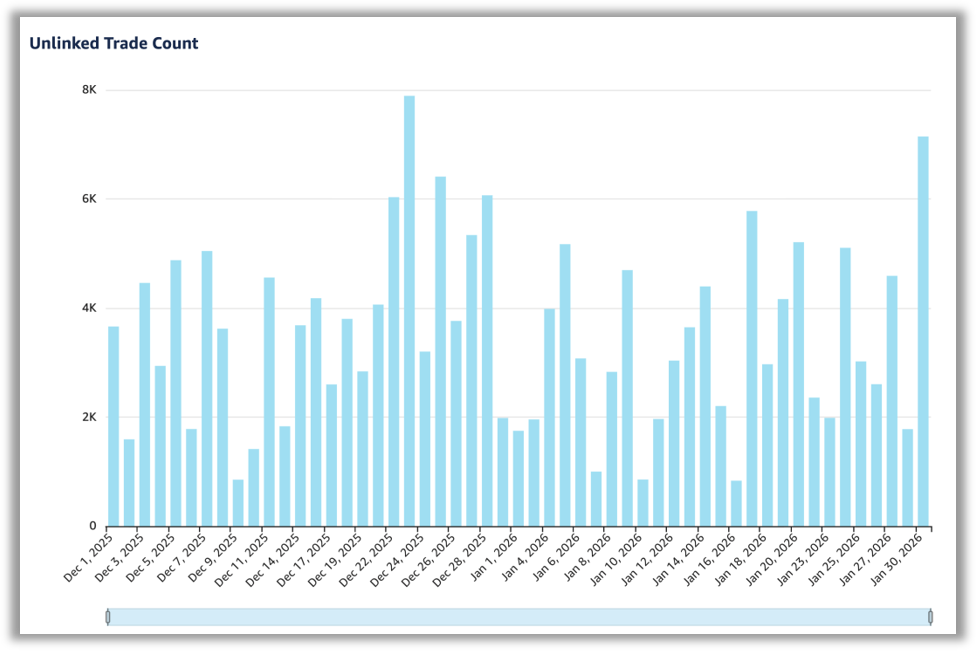
Below the Total Trade Count visualization are three sets of visualizations: Unlinked; Quantity Mismatch; and Price Mismatch. Each set focuses on a distinct category of mismatched trade data and includes two charts: mismatch trade count and mismatch trade rate. Immediately below the Total Trade Count visualization is the first set: the Unlinked Trade Count and Unlinked Trade Rate visualizations. On the left, the Unlinked Trade Count Visualization reflects the daily count of trades where the Interactive Report Card was unable to link a trade event between the CAT and TRF/ORF records.
To the right, the Unlinked Trade Rate visualization reflects the daily rate of trades where linkage could not be established between the CAT and TRF/ORF records. The Unlinked Trade Rate is calculated as follows:

The Unlinked Trade Rate visualization also contains a horizontal line that represents the Monthly Peer Group Unlinked Rate among your peer firms. To calculate the Monthly Peer Group Unlinked Rate, at the end of a month the Interactive Report Card calculates the individual monthly unlinked rate for each firm, selects all rates for an individual peer group, sums them and divides them by the number of peers within the peer group. The Interactive Report Card then multiplies this number by 100 to arrive at the Monthly Peer Group Unlink Rate.

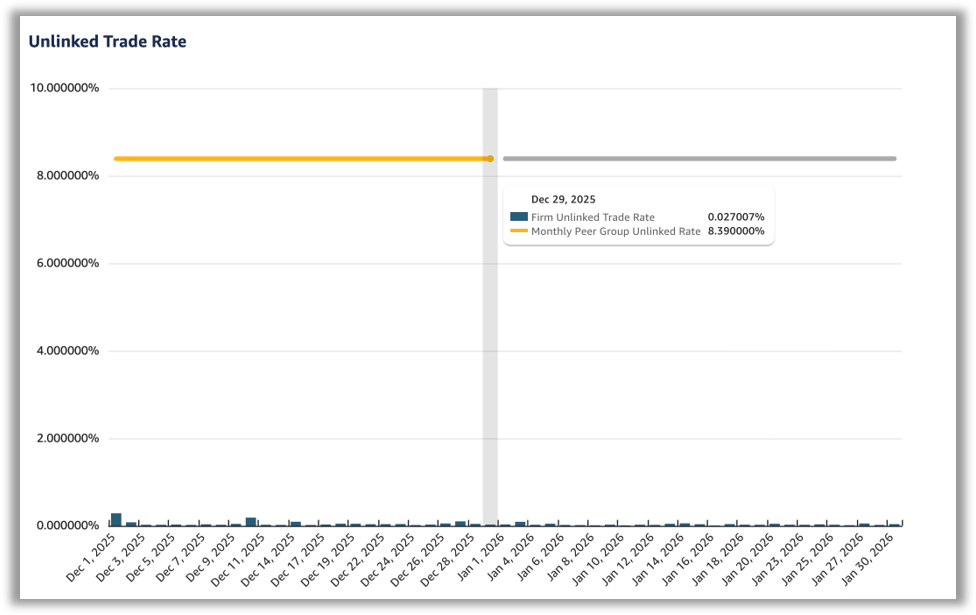
For completed months (such as December trade dates viewed during the month of January), the line will be orange, representing finalized peer group members and statistics. For an in-progress month (such as January trade dates viewed during the month of January), the line will be gray, representing projected peer group statistics using the previous month’s calculations.
Unlinked Trade Details
By default, the Unlinked Trade Details tab displays all unlinked trades for the dates selected in the control panel.
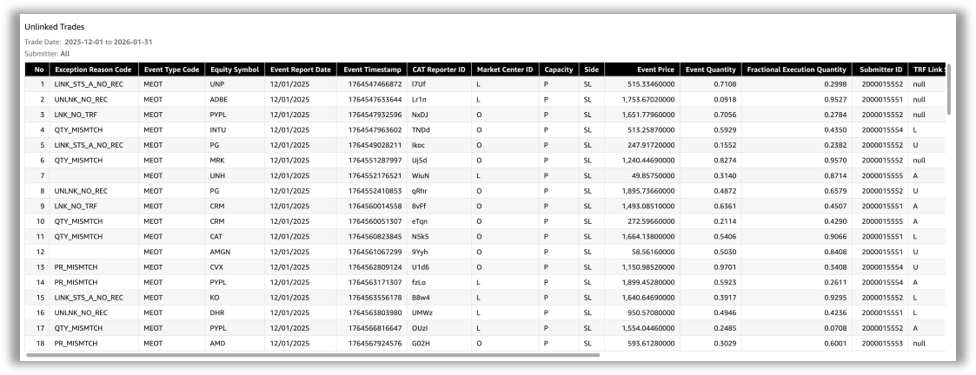
To access the underlying trade details for a specific date, click on the Unlinked Trade Count or Rate bar for that date. The Interactive Report Card will open the Unlinked Trade Details tab and populate the tab with a table that contains each Unlinked Trade for that date. For example, selecting either the Unlinked Trade Count or Rate bar for January 30, 2026, opens the Unlinked Trade details tab:
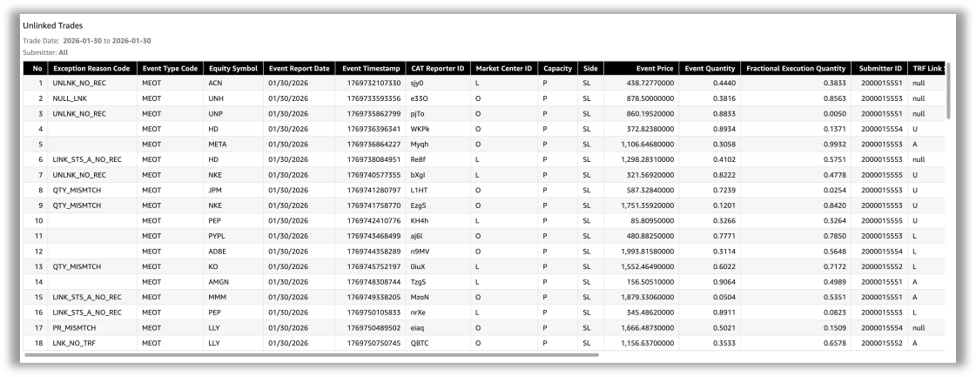
The data contained in the Unlinked Trade Details tab follows the layout in the Unlinked Trade export file table below. You may also export the underlying trade details using the export function described below.
Quantity Mismatch: Trade Count and Rate Visualizations
Beneath the Unlinked Trade visualizations on the Dashboard, on the left the Quantity Mismatch Count visualization shows the number of trades for each trade date that were linked but had different trade quantities reported to CAT and the TRF/ORF.
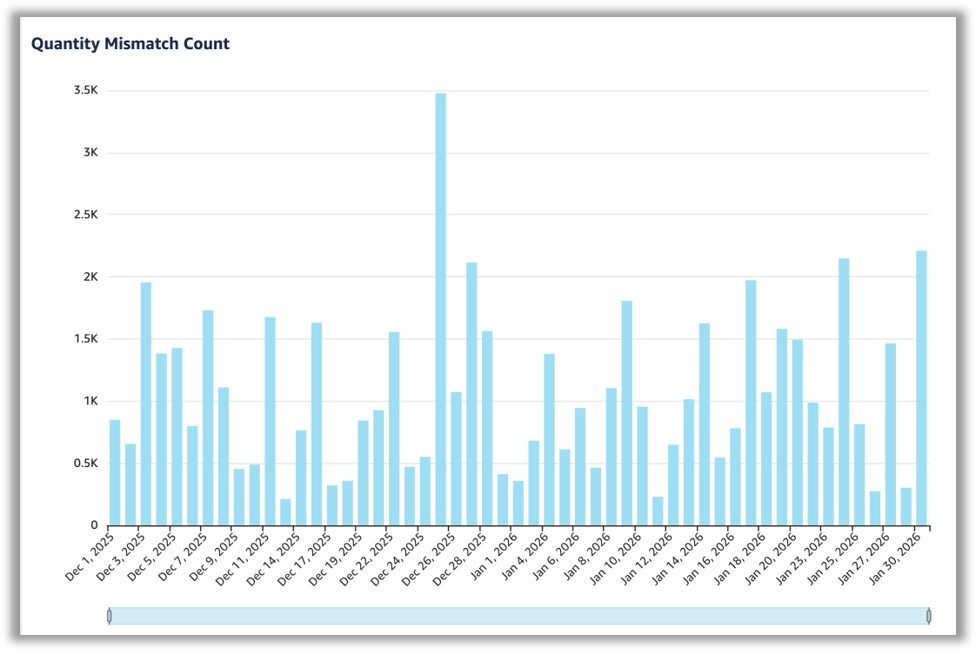
To the right , the Quantity Mismatch Rate visualization reflects the daily rate of trades where the Interactive Report Card linked a trade event between the CAT and TRF/ORF records but observed a difference in the quantity reported. The Quantity Mismatch Rate is calculated as follows:

The Quantity Mismatch Rate visualization also contains a horizontal line that represents the Monthly Peer Group Quantity Mismatch Rate among your peer firms. To calculate the Monthly Peer Group Quantity Mismatch Rate, at the end of a month the Interactive Report Card calculates the individual monthly quantity mismatch rate for each firm, selects all rates for an individual peer group, sums them and divides them by the number of peers within the peer group. The Interactive Report Card then multiplies this number by 100 to arrive at the Monthly Peer Group Quantity Mismatch Rate.

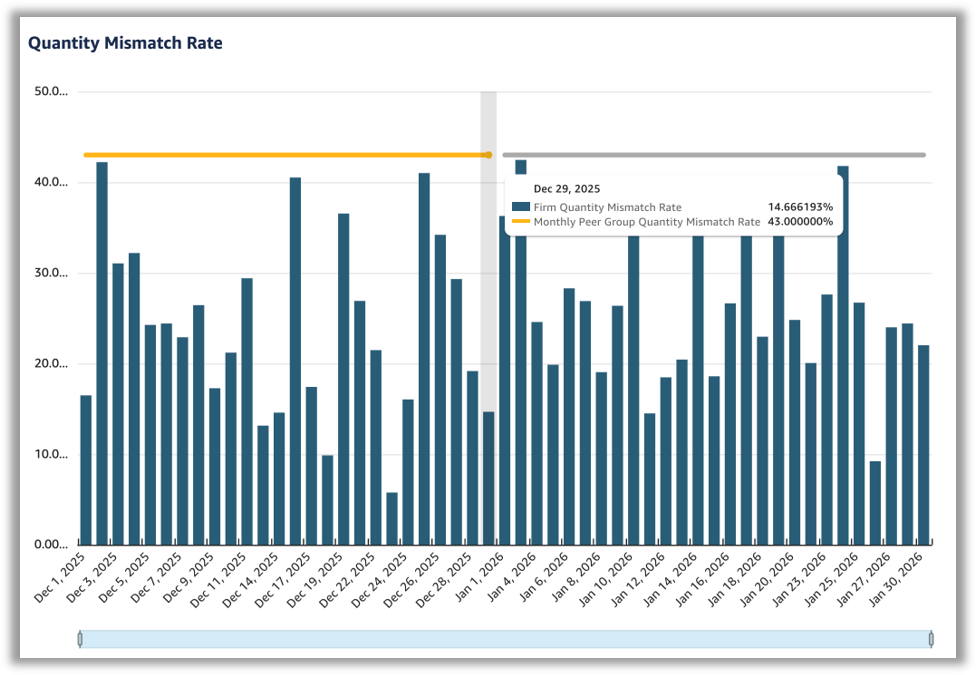
For completed months (such as December trade dates viewed during the month of January), the line will be orange, representing finalized peer group members and statistics. For an in-progress month (such as January trade dates viewed during the month of January), the line will be gray, representing projected peer group statistics using the previous month’s calculations.
Quantity Mismatch Trade Details
By default, the Quantity Mismatch Trade Details tab displays all linked trades with a reported quantity mismatch for the dates selected in the control panel.
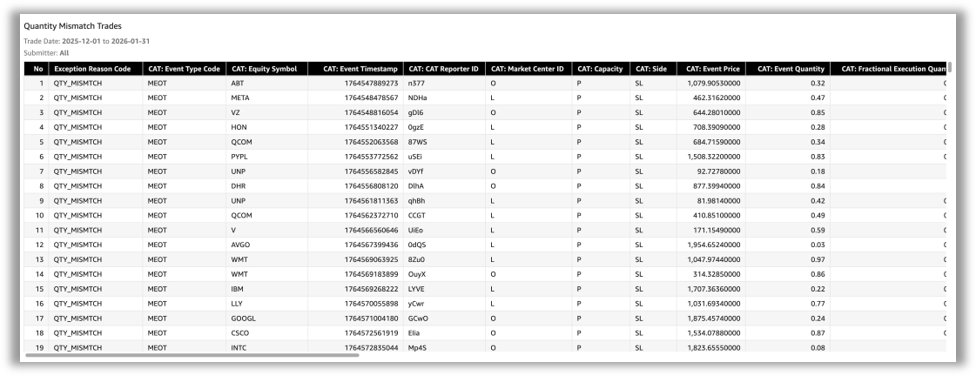
To access the underlying trade details for a specific date, click on the Quantity Mismatch Trade Count or Rate bar for that date. The Interactive Report Card will open the Quantity Mismatch Trade Details tab and populate the tab with a table that contains each Quantity Mismatch Trade for that date. For example, selecting either the Quantity Mismatch Trade Count or Rate bar for January 30, 2026, opens the Quantity Mismatch Trade details tab:
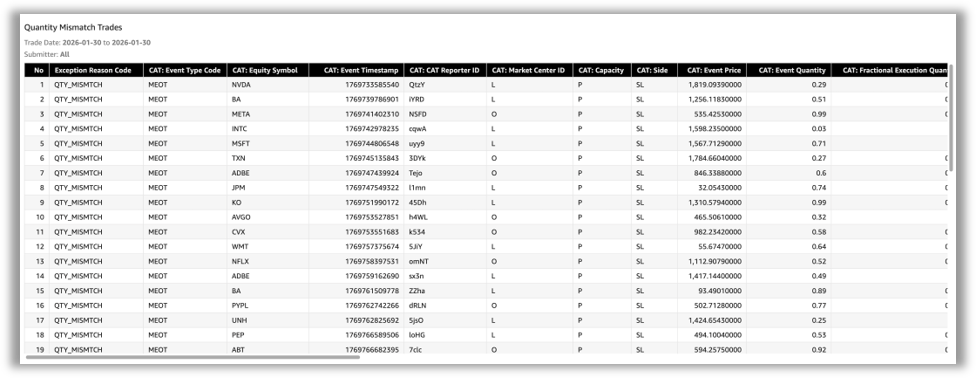
The data contained in the Quantity Mismatch Trade Details tab follows the layout in the Quantity Mismatch Trade export file table below. You may also export the underlying trade details using the export function described below.
Price Mismatch Trade Count and Rate Visualizations
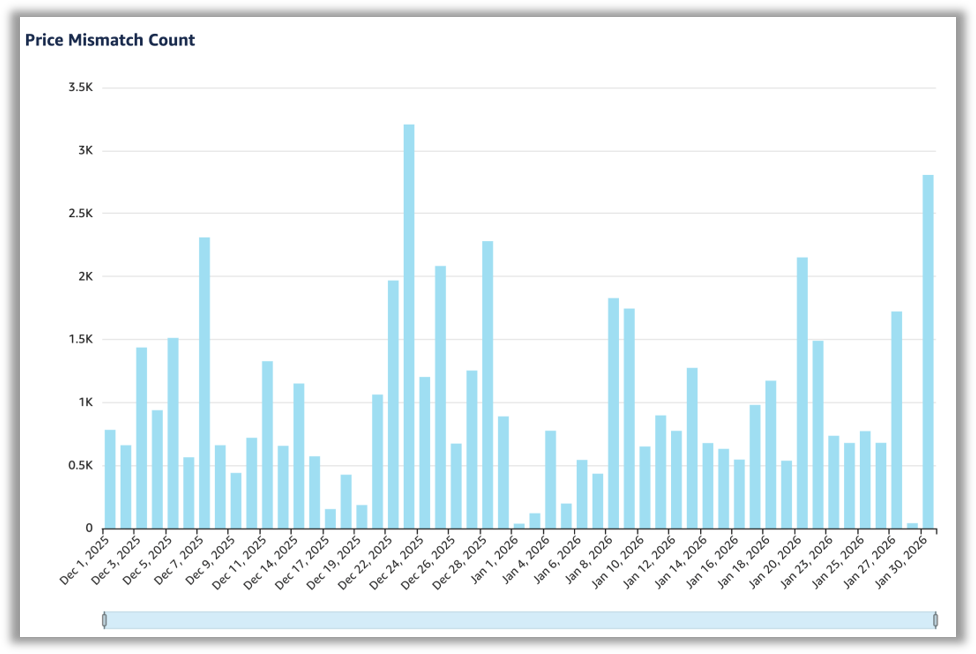
Beneath the Quantity Mismatch Trade visualizations on the Dashboard, on the left the Price Mismatch Count visualization shows the number of trades for each trade date that were linked but had different prices reported to CAT and the TRF/ORF.
To the right, the Price Mismatch Rate visualization reflects the daily rate of trades where the Interactive Report Card linked a trade event between the CAT and TRF/ORF records but observed a difference in the price reported. The Price Mismatch Rate is calculated as follows:

The Price Mismatch Rate visualization also contains a horizontal line that represents the Monthly Peer Group Price Mismatch Rate among your peer firms. To calculate the Monthly Peer Group Price Mismatch Rate, at the end of a month the Interactive Report Card calculates the individual monthly price mismatch rate for each firm, selects all rates for an individual peer group, sums them and divides them by the number of peers within the peer group. The Interactive Report Card then multiplies this number by 100 to arrive at the Monthly Peer Group Price Mismatch Rate.

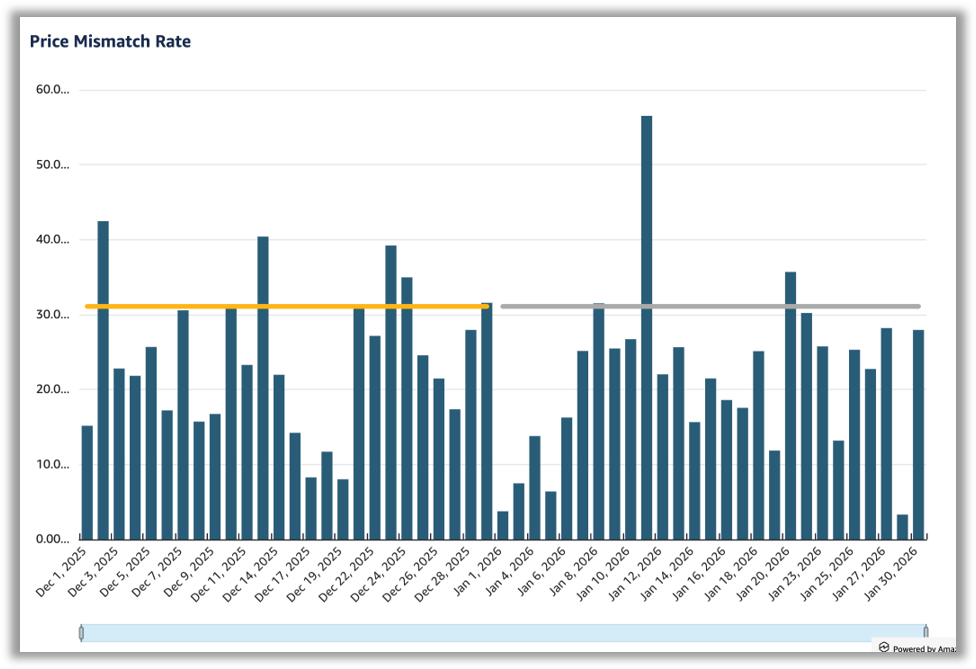
For completed months (such as December trade dates viewed during the month of January), the line will be orange, representing finalized peer group members and statistics. For an in-progress month (such as January trade dates viewed during the month of January), the line will be gray, representing projected peer group statistics using the previous month’s calculations.
Price Mismatch Trade Details
By default, the Price Mismatch Trade Details tab displays all linked trades with a reported price mismatch for the dates selected in the control panel.
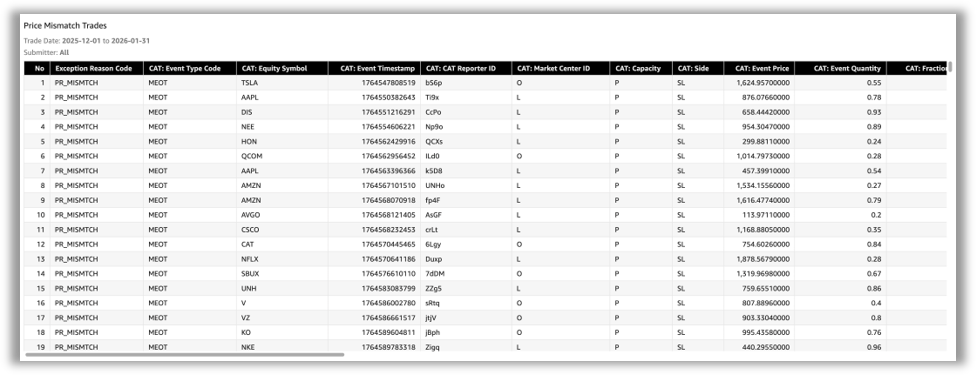
To access the underlying trade details for a specific date, click on the Price Mismatch Trade Count or Rate bar for that date. The Interactive Report Card will open the Price Mismatch Trade Details tab and populate the tab with a table that contains each Price Mismatch Trade for that date. For example, selecting either the Price Mismatch Trade Count or Rate bar for January 30, 2026, opens the Price Mismatch Trade details tab:
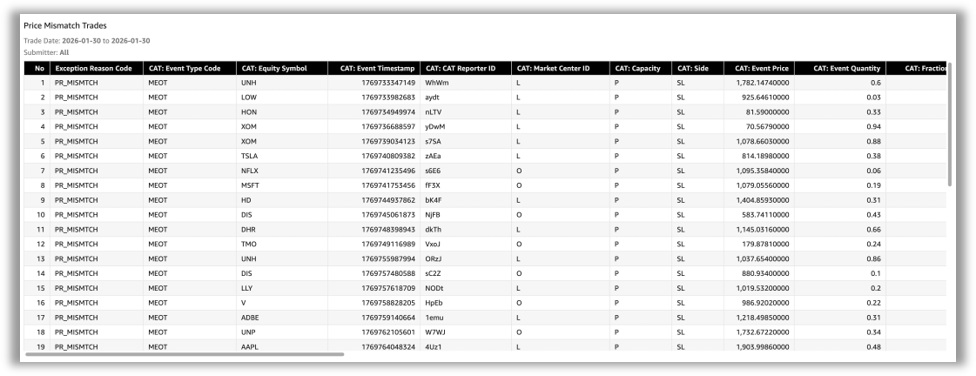
The data contained in the Price Mismatch Trade Details tab follows the layout in the Price Mismatch Trade export file table below. You may also export the underlying trade details using the export function described below.
Peer Firms Information
The Peer Firms Information tab is located on the far right of the control panel. Clicking on a particular month allows you gain better insight into your firm’s peer group. As shown below, December 2025 brings up FAKE-A CORPORATION (Tier 5).
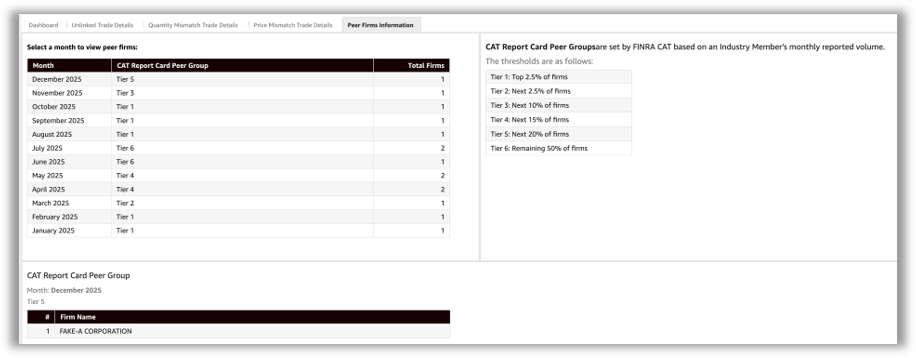
This Interactive Report Card leverages the FINRA CAT Report Card Peer Groups based on the volume of monthly reported CAT Record to place members in the following six tiers:
- Tier 1: Top 2.5 percent of firms
- Tier 2: Next 2.5 percent of firms
- Tier 3: Next 10 percent of firms
- Tier 4: Next 15 percent of firms
- Tier 5: Next 20 percent of firms
- Tier 6: Remaining 50 percent of firms
CAT Report Card Peer Groups are classification categories FINRA CAT established to facilitate meaningful comparisons among similar firms. These peer groups are specifically determined based on monthly reported record volume to the CAT system. More information on the FINRA CAT report cards and associated terms is available on catnmsplan.com in the Industry Member Compliance Glossary.
Self-Set Notifications
As a supplement to track and trend visuals and data described above, FINRA offers a self-set notification feature, empowering users to customize when and how they engage with the Interactive Report Card based on their specific roles and needs.
How to Set Up Notifications
From within the Trade Data Consistency Report Card, navigate to “Self-Set Notifications” in the top banner and select “Add Notification Rule.”
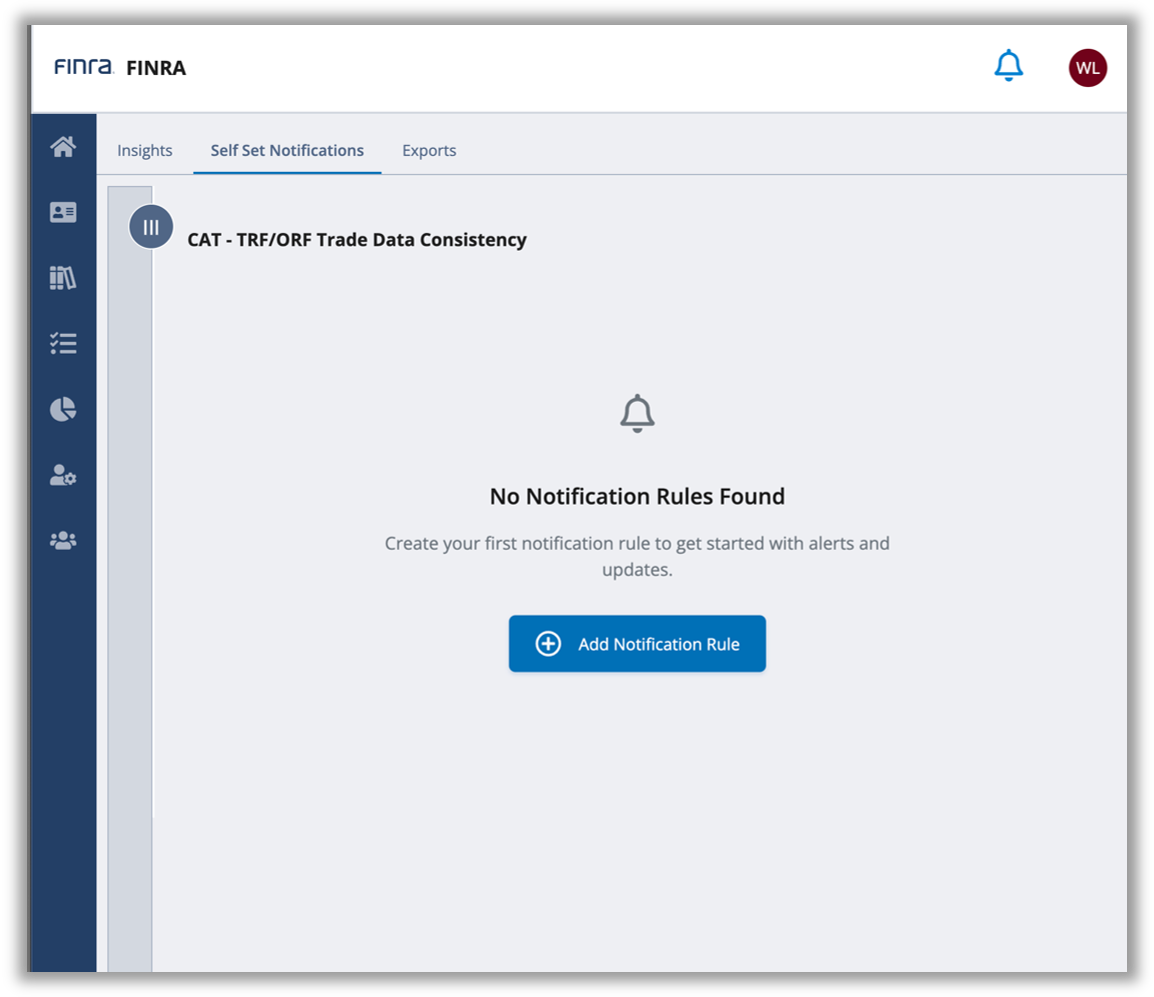
Once selected, a dialogue box will appear that allows you to configure a set of parameters (a “Rule”) that will result in FINRA sending a notification if the conditions of the Rule are met. The top left dialogue box prompts you to select from six different Trade Data Consistency Metrics: (1) Price Mismatch Trade Count; (2) Price Mismatch Trade Rate; (3) Quantity Mismatch Trade Count; (4) Quantity Mismatch Trade Rate; (5) Unlinked Trade Count; and (6) Unlinked Trade Rate.
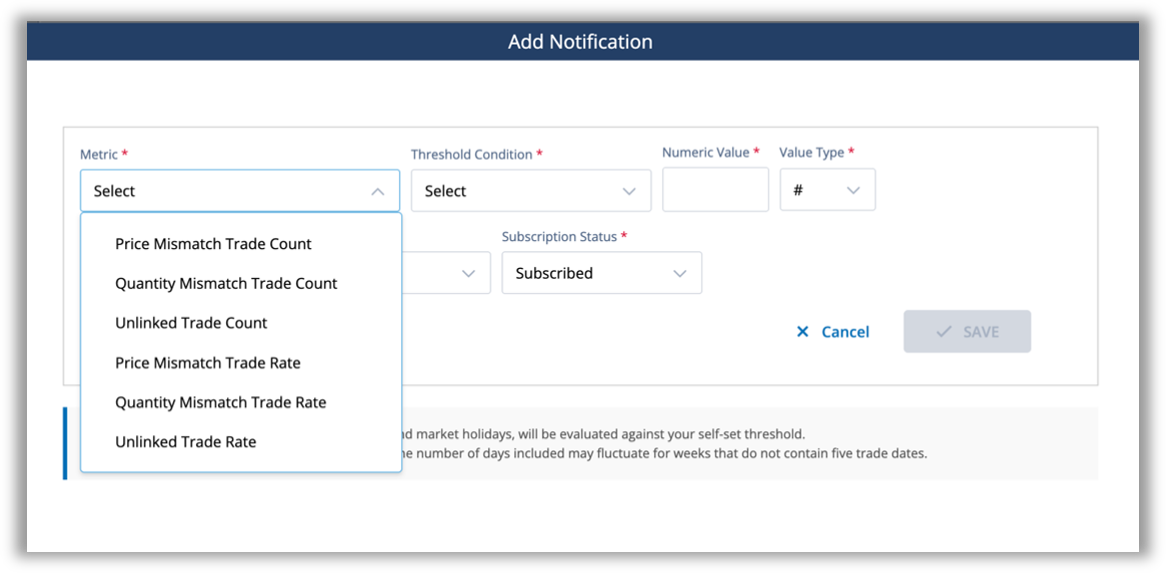
| Metric Name | Metric Definition |
|---|---|
| Price Mismatch Trade Count | The number of trades with mismatched prices for a given trade date. |
| Price Mismatch Trade Rate | The number of trades with mismatched prices out of the total number of linked trades for a given trade date. |
| Quantity Mismatch Trade Count | The number of trades with mismatched quantities for a given trade date. |
| Quantity Mismatch Trade Rate | The number of trades with mismatched quantities out of the total number of linked trades for a given trade date. |
| Unlinked Trade Count | The number of trades that could not be linked between Consolidated Audit Trail and TRF/ORF reports. |
| Unlinked Trade Rate | The number of trades that could not be linked between Consolidated Audit Trail and TRF/ORF reports out of the total number of trades reported. |
Once you select a Metric, there are three inputs that create a Rule related to that Metric: (1) Threshold Condition (2) Numeric Value; and (3) Value Type.
The first input, Threshold Condition, allows you to select from the following values:
- increased by;
- decreased by;
- is equal to;
- is greater than;
- is greater than or equal to;
- is less than; and
- is less than or equal to.
Following the selection of a Threshold Condition, enter a value in the Numeric Value field and define the value as a percentage or a number in the Value Type input. An example of a Rule could be, for Price Mismatch Trade Count, if this Metric is greater than or equal to 100 instances send me a notification.
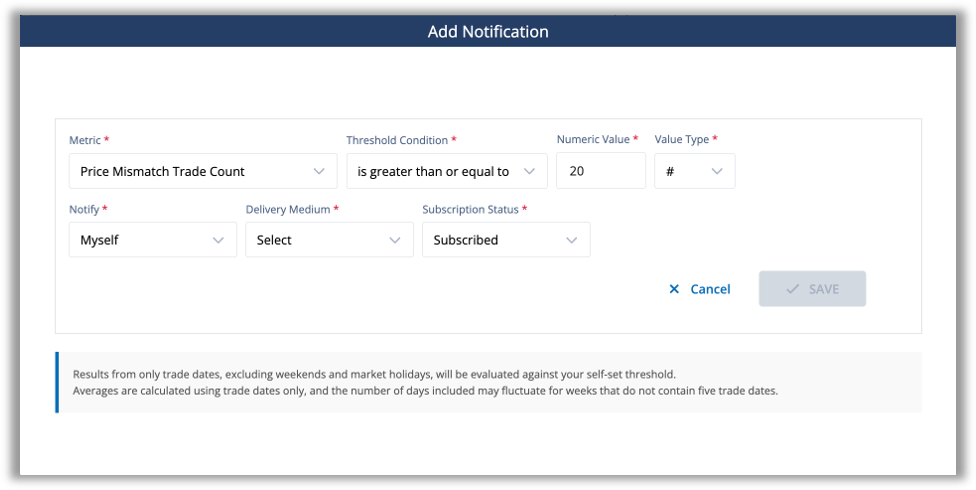
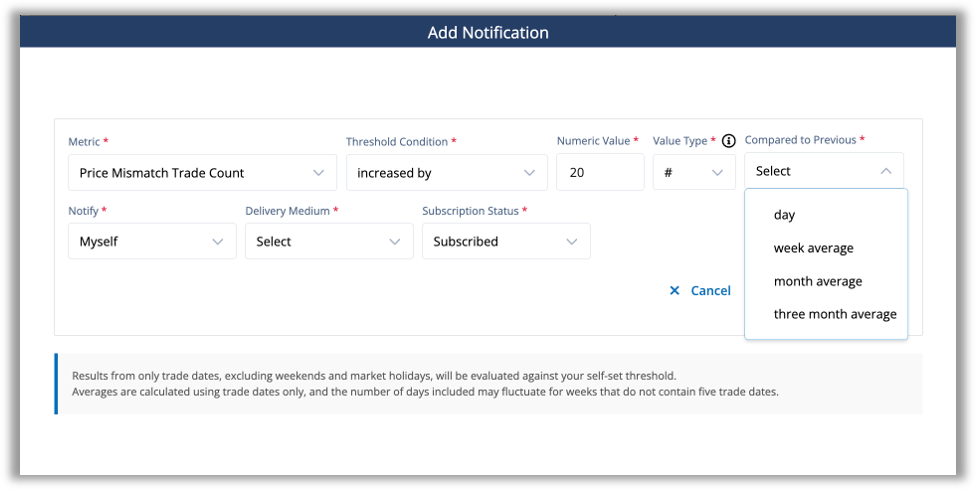
If you select a Threshold Condition of “increased by” or “decreased by”, you can select from the following evaluation periods in the Compared to Previous drop-down.
- day;
- week average;
- month average; and
- three-month average.
Note: Results from only trade dates, excluding weekends and market holidays, will be evaluated against your self-set threshold.
Averages are calculated using trade dates only, and the number of days included may fluctuate for weeks that do not contain five trade dates.
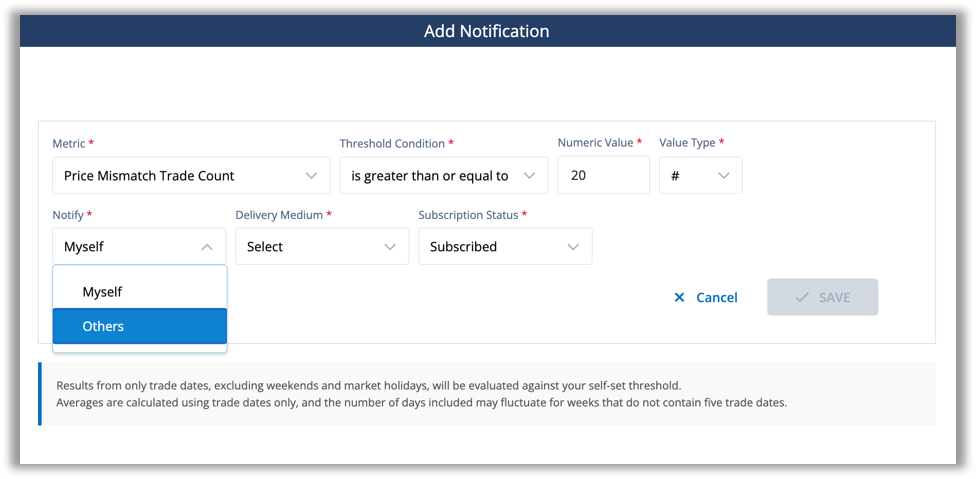
Once you have finalized the notification criteria, you can configure who is notified when a Rule's criteria are met as well as the notification method. Additionally, you can enable or pause notifications using the Subscription Status drop-down. Specifically, the Notify field is auto populated with “Myself,” but will include the ability to send to a group email if you have the appropriate permissions (see the next section for more details). The Delivery Medium field allows you to select to be notified via email, via the Gateway notification feature (“Web”), or both; and Subscription Status, which defaults to “subscribed” initially and permits you to “unsubscribe” to previously set Rules – giving you the flexibility to pause a rule without deleting it, and then resubscribe at a later date.
Once you save a Rule, FINRA will evaluate the relevant Metric against your Threshold on the cadence you have set when the underlying data becomes available. When a relevant threshold is met or exceeded, FINRA will notify you using the Delivery Medium you selected. At any time, you can revisit an existing Rule on the Self-Set Notification page to manage existing Self-Set Notification Rules, create new Rules or unsubscribe from Rules. After you unsubscribe from or delete a Rule, FINRA will no longer evaluate a Metric for the Rule that you had created.
Setting up a Group Notification
Firms may designate certain users to create custom notifications for groups within their organization, including existing distribution lists or group inboxes. These group notifications operate identically to individual user notifications but reach multiple recipients simultaneously.
To set up a group notification, you must have the Interactive Reports Notification Distribution List entitlement. If you are a Super Account Administrator (“SAA”), you can enable this entitlement for yourself or assign it to a member of your firm. If you are not an SAA, please reach out to your SAA to obtain this credential. Once you have the appropriate entitlement, you can create, change, or delete group notifications.
To create a group notification, complete the Rule setting component (i.e., Metric, Threshold Condition, Numeric Value, Value Type) as outlined above and then in the Notify dialog box select “Others.”
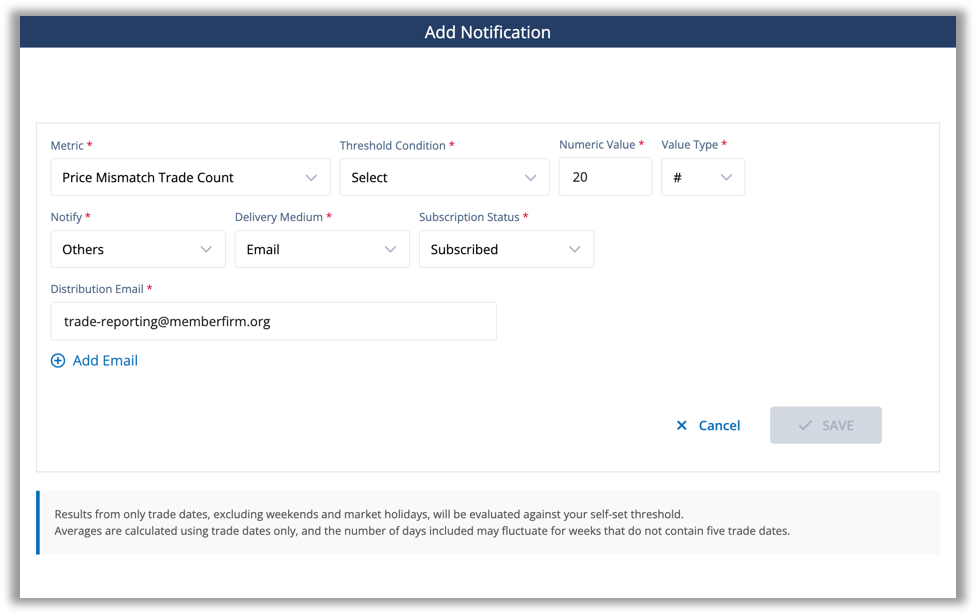
Once you have selected Notify Others, a dialogue box will open called “Distribution Email.” Please enter your desired group email address (e.g., [email protected]) in the Distribution Email free text space. You may enter more than one email address. Once saved, when a relevant threshold is met or exceeded, FINRA will send notifications to this group's email address.
Users with Interactive Reports Notification Distribution List entitlement can edit or unsubscribe from existing group notifications through the Self-Set Notification navigation tab at the top of the Interactive Report Cards user interface.
Self-Set Notification Reference Table
| Attribute Name | Attribute Descriptions |
|---|---|
| Metric |
|
| Threshold Condition |
|
| Numeric Value |
|
| Value Type |
|
| Notify |
* The Others option is only available to users who have the Interactive Reports Notification Distribution List entitlement granted by their firm's Super Account Administrator. This option allows designated users, inside a firm, to create or modify custom notifications to be sent to individuals inside their organization, other than themselves, or to shared inbox addresses who would not otherwise have a user account. |
| Delivery Medium |
Web refers to being notified through the Gateway’s notifications, upon logging-in. Email is a notification sent to a designated email address. Web & Email are both methods listed above, at the same time. |
| Subscription Status |
This selection designates if a Custom Notification is currently active or inactive. |
Export to CSV
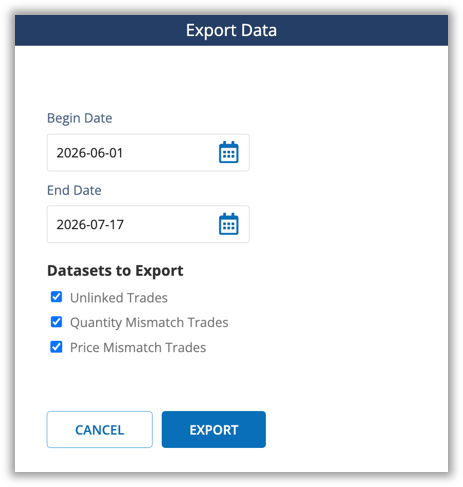
The Export to CSV function facilitates member firm analysis outside the Interactive Report Card. For example, when facilitating internal root cause analysis or enriching report card data with additional member-specific information to facilitate analysis.
To access the export to CSV function, please select the Export to CSV button at the top of the Trade Data Consistency Interactive Report Card.
Export File Layouts
Unlinked Trades
| Column Name | Column Description |
|---|---|
| No | Record number |
| Exception Reason Code | Code identifying the linkage scenario for which the exception was created. |
| Event Type Code | Identification of the kind of event represented by the record as reported to CAT |
| Equity Symbol | Equity symbol used to identify the security, as reported to CAT. |
| Event Report Date | Date when the trade was reported to CAT. |
| Event Timestamp | Timestamp of the trade execution time, as reported to CAT. |
| CAT Reporter ID | Identifier of the Industry Member which reported the event to CAT |
| Market Center ID | The market center on which the event takes place, as reported to CAT A – NYSE American, LLC (formerly NYSE MKT, American Stock Exchange) B – Nasdaq BX (formerly Boston Stock Exchange) C – NYSE National, Inc D – Off Exchange (FINRA TRF/ADF) H – MIAX PEARL Exchange J – Cboe EDGA Exchange, Inc. (formerly DirectEdge A) K – Cboe EDGX Exchange, Inc. (formerly DirectEdge X) L – Long-Term Stock Exchange (LTSE) M – NYSE Chicago Stock Exchange, Inc. N – New York Stock Exchange, LLC (NYSE) P – NYSE Arca, Inc. Q – Nasdaq Stock Market, LLC U – Members Exchange (MEMX) V – Investors’ Exchange, LLC. (IEX) X – Nasdaq PSX (Formerly Nasdaq OMX PSX, Philadelphia Stock Exchange) Y – Cboe BYX Exchange, Inc. Z – Cboe BZX Exchange, Inc. |
| Capacity | The code submitted of a given side of a trade A = Agency P = Principal R = Riskless Principal |
| Side | Indicates whether the event represents a Buy ‘B’ or a Sell ‘S’ transaction |
| Event Price | The price associated with the event |
| Event Quantity | The quantity associated with the event |
| Fractional Execution Quantity | The fractional share quantity associated with the event. Ex: A trade with a quantity of 30.152 would have a fractional execution quantity of .152. |
| Submitter ID | The CRD of the submitter. |
| TRF Link Status Code | Code derived by the CAT linkage process which is intended to identify linkage between firm lifecycles and TRF reporting. |
| Tape Trade ID | The unique identifier reported by the Industry Member to the TRF/ADF/ORF based on the reporting specifications of the specific facility, required when the ID was supplied to a transaction reporting system, as reported to CAT |
| Order ID | The order identifier generated for each new order. |
| ROE ID | Internal identifier assigned by the Industry Member to uniquely represent a record in CAT |
| Submitter | Name and CRD of the CAT submitter |
| Firm CRD | The CRD for the reporting firm |
Quantity Mismatch
| Column Name | Column Description |
|---|---|
| No | Record number |
| Exception Reason Code | Code identifying the linkage scenario for which the exception was created. Price and quantity mismatch can be identified on the same record |
| CAT: Event Type Code | Identification of the kind of event represented by the record as reported to CAT |
| CAT: Equity Symbol | Equity symbol used to identify the security, as reported to CAT. |
| CAT: Event Timestamp | Timestamp of the trade execution time, as reported to CAT. |
| CAT: CAT Reporter ID | Identifier of the Industry Member which reported the event to CAT |
| CAT: Market Center ID | The market center on which the event takes place, as reported to CAT A – NYSE American, LLC (formerly NYSE MKT, American Stock Exchange) B – Nasdaq BX (formerly Boston Stock Exchange) C – NYSE National, Inc D – Off Exchange (FINRA TRF/ADF) H – MIAX PEARL Exchange J – Cboe EDGA Exchange, Inc. (formerly DirectEdge A) K – Cboe EDGX Exchange, Inc. (formerly DirectEdge X) L – Long-Term Stock Exchange (LTSE) M – NYSE Chicago Stock Exchange, Inc. N – New York Stock Exchange, LLC (NYSE) P – NYSE Arca, Inc. Q – Nasdaq Stock Market, LLC U – Members Exchange (MEMX) V – Investors’ Exchange, LLC. (IEX) X – Nasdaq PSX (Formerly Nasdaq OMX PSX, Philadelphia Stock Exchange) Y – Cboe BYX Exchange, Inc. Z – Cboe BZX Exchange, Inc. |
| CAT: Capacity | The code submitted of a given side of a trade as reported to CAT A = Agency P = Principal R = Riskless Principal |
| CAT: Side | Indicates whether the event represents a Buy ‘B’ or a Sell ‘S’ transaction, as reported to CAT |
| CAT: Event Price | The price associated with the event, as reported to CAT |
| CAT: Event Quantity | The quantity associated with the event, as reported to CAT |
| CAT: Fractional Execution Quantity | The fractional share quantity associated with the event, as reported to CAT. Ex: A trade with a quantity of 30.152 would have a fractional execution quantity of .152 |
| CAT: Submitter ID | The CRD of the submitter. |
| CAT: Tape Trade ID | The unique identifier reported by the Industry Member to the TRF/ADF/ORF based on the reporting specifications of the specific facility, required when the ID was supplied to a transaction reporting system, as reported to CAT |
| CAT: ROE ID | Internal identifier assigned by the Industry Member to uniquely represent a record in CAT |
| TRF: Execution Time | The time at which the trade was executed, as reported to the TRF/ORF |
| TRF: Reporting Execution MPID | The market participant identifier of the Reporting Execution firm, as reported to the TRF/ORF |
| TRF: Reporting Capacity | Capacity (principal, agent, riskless) of the reporting-side firm, as reported to the TRF/ORF. P=Principal A=Agency R=Riskless Principal |
| TRF: Report Side Code | The side of the trade (buy/sell/cross) from the perspective of the firm with the reporting obligation, as reported to the TRF/ORF. B=Buy Side |
| TRF: Execution Price | Unit price of the trade, as reported to the TRF/ORF |
| TRF: Execution Quantity | Number of shares traded, as reported to the TRF/ORF |
| TRF: Contra Execution MPID | MPID of the contra executing party, as reported to the TRF/ORF |
| TRF: Reporting Branch Sequence Number | Branch/sequence number of the reporting-side firm, as reported to the TRF/ORF |
| TRF: Control Number | A unique identifier for the reporting side of each trade transaction. |
| TRF: TRF Control Number | Control number used for interaction between firms and TRFs. |
| Submitter | Name and CRD of the CAT submitter |
| Firm CRD | The CRD for the reporting firm |
| Trade Date | The date on which the trade was executed |
Price Mismatch
| Column Name | Column Description |
|---|---|
| No | Record number |
| Exception Reason Code | Code identifying the linkage scenario for which the exception was created. Price and quantity mismatch can be identified on the same record. |
| CAT: Event Type Code | Identification of the kind of event represented by the record as reported to CAT |
| CAT: Equity Symbol | Equity symbol used to identify the security, as reported to CAT. |
| CAT: Event Timestamp | Timestamp of the trade execution time, as reported to CAT. |
| CAT: CAT Reporter ID | Identifier of the Industry Member which reported the event to CAT |
| CAT: Market Center ID | The market center on which the event takes place, as reported to CAT A – NYSE American, LLC (formerly NYSE MKT, American Stock Exchange) B – Nasdaq BX (formerly Boston Stock Exchange) C – NYSE National, Inc D – Off Exchange (FINRA TRF/ADF) H – MIAX PEARL Exchange J – Cboe EDGA Exchange, Inc. (formerly DirectEdge A) K – Cboe EDGX Exchange, Inc. (formerly DirectEdge X) L – Long-Term Stock Exchange (LTSE) M – NYSE Chicago Stock Exchange, Inc. N – New York Stock Exchange, LLC (NYSE) P – NYSE Arca, Inc. Q – Nasdaq Stock Market, LLC U – Members Exchange (MEMX) V – Investors’ Exchange, LLC. (IEX) X – Nasdaq PSX (Formerly Nasdaq OMX PSX, Philadelphia Stock Exchange) Y – Cboe BYX Exchange, Inc. Z – Cboe BZX Exchange, Inc. |
| CAT: Capacity | The code submitted of a given side of a trade as reported to CAT A = Agency P = Principal R = Riskless Principal |
| CAT: Side | Indicates whether the event represents a Buy ‘B’ or a Sell ‘S’ transaction, as reported to CAT |
| CAT: Event Price | The price associated with the event, as reported to CAT |
| CAT: Event Quantity | The quantity associated with the event, as reported to CAT |
| CAT: Fractional Execution Quantity | The fractional share quantity associated with the event, as reported to CAT. Ex: A trade with a quantity of 30.152 would have a fractional execution quantity of .152 |
| CAT: Submitter ID | The CRD of the submitter. |
| CAT: Tape Trade ID | The unique identifier reported by the Industry Member to the TRF/ADF/ORF based on the reporting specifications of the specific facility, required when the ID was supplied to a transaction reporting system, as reported to CAT |
| CAT: ROE ID | Internal identifier assigned by the Industry Member to uniquely represent a record in CAT |
| TRF: Execution Time | The time at which the trade was executed, as reported to the TRF/ORF |
| TRF: Reporting Execution MPID | The market participant identifier of the Reporting Execution firm, as reported to the TRF/ORF |
| TRF: Reporting Capacity | Capacity (principal, agent, riskless) of the reporting-side firm, as reported to the TRF/ORF. P=Principal A=Agency R=Riskless Principal |
| TRF: Report Side Code | The side of the trade (buy/sell/cross) from the perspective of the firm with the reporting obligation, as reported to the TRF/ORF. B=Buy Side |
| TRF: Execution Price | Unit price of the trade, as reported to the TRF/ORF |
| TRF: Execution Quantity | Number of shares traded, as reported to the TRF/ORF |
| TRF: Contra Execution MPID | MPID of the contra executing party, as reported to the TRF/ORF |
| TRF: Reporting Branch Sequence Number | Branch/sequence number of the reporting-side firm, as reported to the TRF/ORF |
| TRF: Control Number | A unique identifier for the reporting side of each trade transaction. |
| TRF: TRF Control Number | Control number used for interaction between firms and TRFs. |
| Submitter | Name and CRD of the CAT submitter |
| Firm CRD | The CRD for the reporting firm |
| Trade Date | The date on which the trade was executed |