Contra Executing Firm 20 Minute Compliance Report Card
The Contra Executing Firm 20 Minute Compliance report card is a monthly status report that provides information on transactions in which a firm failed, as the Contra Firm to accept / decline / compare trades within 20 minutes after execution, in apparent violation of FINRA Rules 7230A(b) and/or 7330(b). It provides information about the number of trades that were accepted / declined / compared within 20 minutes of execution along with the number of trades that were accepted / declined / compared greater than 20 minutes after execution time, as well as the percentage of those trades to total trades executed.
The table below provides a reference description for all of the elements found in the Contra Executing Firm 20 Minute Compliance Report Card. (See Contra Executing Firm 20 Minute Compliance Report Card Figures 1 - 2 for a sample segment of the report.)
|
Term |
Definition |
|---|---|
| Industry | The industry consists of all market participants who have at least one transaction for the selected month and year. |
| MP | Market Participant |
| Peer Group | A peer group or tier consists of firms within the same predetermined range of transactions as identified in the table below: |
|
NASDAQ |
CQS |
Other |
ALL |
||||
|---|---|---|---|---|---|---|---|
|
Peer Group/Tier |
Number of Contra Firm Entries |
Peer Group/Tier |
Number of Contra Firm Entries |
Peer Group/Tier |
Number of Contra Firm Entries |
Peer Group/Tier |
Number of Contra Firm Entries |
| 1 | 200,000 or more | 1 | 10,000 or more | 1 | 75,000 or more | 1 | 200,000 or more |
| 2 | 50,000 to 199,999 | 2 | 1,000 to 9,999 | 2 | 10,000 to 74,999 | 2 | 50,000 to 199,999 |
| 3 | 10,000 to 49,999 | 3 | 1 to 999 | 3 | 1,000 to 9,999 | 3 | 10,000 to 49,999 |
| 4 | 1,000 to 9,999 | Not Applicable | 4 | 1 to 999 | 4 | 1,000 to 9,999 | |
| 5 | 1 to 999 | Not Applicable | Not Applicable | 5 | 1 to 999 | ||
|
Term |
Definition |
|---|---|
| All Time Intervals | This column contains a total count of all time intervals. For the rows containing trades and alert information, this column contains the total number of trades or alerts for the selected MP for the selected month and year. For the rows containing the percentages and percentiles, the information contained in this column is derived based on the total alerts and trades for the MP for the selected month and year. (Please refer to the definitions for the percentages and percentile for the algorithms used to derive percentages and percentiles.) |
| Total Contra Executing Firm Entries | This is the total number of entries submitted by the selected MP as the Contra Executing Firm for the selected month and year in the given time interval. |
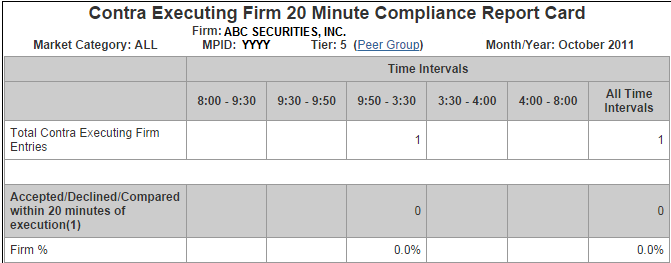
Contra Executing Firm 20 Minute Compliance Report Card Figure 1
|
Term |
Definition |
|---|---|
| Accepted / Declined / Compared within 20 minutes of execution | This is the total number of entries that were accepted / declined / compared by the MP within the required 20 minute period, for the selected month and year in a given time interval. |
| Firm % | This is the percentage of compliant entries that were accepted / declined / compared for the selected MP for the selected month and year in the given time interval. (% compared within 20 minutes = (Contra Firm entries accepted / declined / compared within 20 minutes / Total Contra Firm Entries) x 100) |
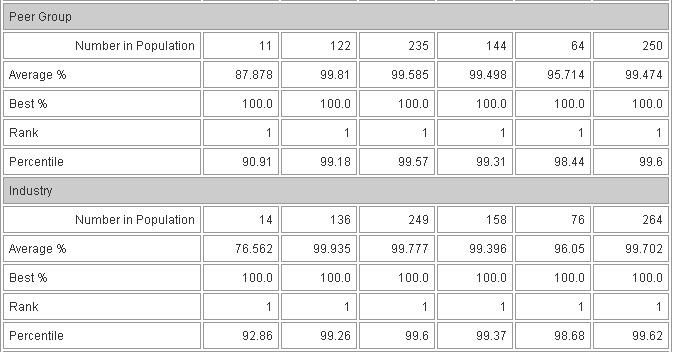
| Peer Group | |
| Number in Population | This is the total number of MPs in the peer group for the selected month and year for the given time interval. |
| Average % | This is the average percentage of compliant entries that were accepted / declined / compared among the firms in the selected MP's peer group for the selected month and year in the given time interval. (AVG % Trades Compared Within 20 Minutes = (Sum of Trades Compared Within 20 Minutes for all firms in the peer group in this time interval / Total Contra Executing Firm Entries for All Firms in Peer Group in this time interval) x 100) |
| Best % | This is the best or highest percentage of compliant entries that were accepted / declined / compared among the firms in the selected MP's peer group for the selected month and year in the given time interval. |
| Rank | This is the rank of the selected MP relative to other MPs in its peer group based on its percentage of compliant entries that were accepted / declined / compared for the selected month and year. The MPs are ranked in descending order from the highest percentage to the lowest percentage. |
| Percentile | This is the selected MP's percentile (PERC), relative to its peers, for its percentage of compliant entries that were accepted / declined / compared for the selected month and year in the given time interval. This percentile is calculated by sorting or ranking the firms based on percentage of compliant entries that were accepted / declined / compared. Once the firms are ranked, the rank of the firm relative to its peers (RANK) can be determined, and the percentile (PERC) can be determined by dividing the firm's rank by the total number of firms being ranked. (PERC = ((Number of firms in peer group - RANK of firm) / Number of firms in peer group) x 100) |
| Industry | |
| Number in Population | This is the total number of MPs in the industry for the selected month and year for the given time interval. |
| Average % | This is the percentage of compliant entries that were accepted / declined / compared among the firms in the industry for the selected month and year in the given time interval. (AVG % Trades Compared Within 20 Minutes = (Sum of Trades Compared Within 20 Minutes for all firms in the industry group in this time interval / Total Executing Contra Firm Entries for All Firms in Industry in this time interval) x 100) |
| Best % | This is the best or highest percentage of compliant entries that were accepted / declined / compared among the firms in the industry for the selected month and year in the given time interval. |
| Rank | This is the rank of the selected MP relative to other MPs in the industry based on its percentage of compliant entries taht were accepted / declined/ comapred for the selected month and year. The MPs are ranked in descending order from the highest percentage to the lowest percentage. |
| Percentile | This is the selected MP's percentile (PERC), relative to other MPs in the industry, for its percentage of compliant Contra Firm entries submitted for the selected month and year in the given time interval. This percentile is calculated by sorting or ranking the firms based on percentage of compliant entries that were accepted / declined / compared. Once the firms are ranked, the rank of the firm relative to the (RANK) can be determined, and the percentile (PERC) can be determined by dividing the firm's rank by the total number of firms being ranked. (PERC = ((Number of firms in industry - RANK of firm) / Number of firms in industry) x 100) |
Contra Executing Firm 20 Minute Compliance Report Card Figure 2
|
Term |
Definition |
|---|---|
| Accepted / Declined / Compared between 21 minutes & 45 minutes | This is the total number of entries that were accepted / declined / compared between 21 minutes and 45 minutes after trade execution for the selected month and year in the given time interval. |
| Firm % | This is the percentage of entries that were accepted / declined / compared by the Contra Firm between 21 minutes and 45 minutes after execution for the selected MP for the selected month and year in the given time interval. (% ≥ 21 minutes ≤ 45 minutes = (Number ≥ 21 minutes ≤ 45 minutes / Total Contra Firm entries) x 100) |
| Peer Group | |
| Number in Population | This is the total number of MPs in the peer group for the selected month and year for the given time interval. |
| Average % | This is the percentage of entries that were accepted / declined / compared by the Contra Firm between 21 minutes and 45 minutes after execution among the firms in the selected MP's peer group for the selected month and year in the given time interval. (AVG % ≥ 21 minutes ≤ 45 minutes = (Sum of ≥ 21 minutes ≤ 45 minutes for all firms in the peer group in this time interval / Total Contra Firm entries for All Firms in Peer Group in this time interval) x 100) |
| Best % | This is the best (lowest) percentage of entries that were accepted / declined / compared between 21 minutes and 45 minutes after execution among the firms in the selected MP's peer group for the selected month and year in the given time interval. |
| Rank | This is the rank of the selected MP relative to other MPs in its peer group based on its percentage of entries that were accepted / declined / compared between 21 minutes and 45 minutes after execution for the selected month and year. The MPs are ranked in ascending order from the lowest percentage to the highest percentage. |
| Percentile | This is the selected MP's percentile (PERC), relative to its peers, for its percentage of entries that were accepted / declined / compared by the Contra firm between 21 minutes and 45 minutes after execution for the selected month and year in the given time interval. This percentile is calculated by sorting or ranking the firms based on a percentage of entries that were accepted / declined / compared by the Contra Firm between 21 minutes and 45 minutes after execution. Once the firms are ranked, the rank of the firm relative to its peers (RANK) can be determined, and the percentile (PERC) can be determined by dividing the firm's rank by the total number of firms being ranked. (PERC = ((Number of firms in peer group - RANK of firm) / Number of firms in peer group) x 100) |
| Industry | |
| Number in Population | This is the total number of MPs in the industry for the selected month and year for the given time interval. |
| Average % | This is the percentage of entries that were accepted / declined / compared by the Contra Firm between 21 minutes and 45 minutes after execution among the firms in the industry for the selected month and year in the given time interval. (AVG % ≥ 21 minutes ≤ 45 minutes = (Sum of ≥ 21 minutes ≤ 45 minutes for all firms in the industry group in this time interval / Total Contra Firm entries for All Firms in Industry in this time interval) x 100) |
| Best % | This is the best (lowest) percentage of entries that were accepted / declined / compared by the Contra Firm between 21 minutes and 45 minutes after execution among the firms in the industry for the selected month and year in the given time interval. |
| Rank | This is the rank of the selected MP relative to other MPs in the industry based on its percentage of entries that were accepted / declined / compared by the Contra Firm between 21 minutes and 45 minutes after execution for the selected month and year. The MPs are ranked in ascending order from the lowest percentage to the highest percentage. |
| Percentile | This is the selected MP's percentile (PERC), relative to other MPs in the industry, for its percentage of entries that were accepted / declined / compared between 21 minutes and 45 minutes after execution for the selected month and year in the given time interval. This percentile is calculated by sorting or ranking the firms based on percentage of entries that were accepted / declined / compared by the Contra Firm between 21 minutes and 45 minutes after execution. Once the firms are ranked, the rank of the firm relative to the (RANK) can be determined, and the percentile (PERC) can be determined by dividing the firm's rank by the total number of firms being ranked. (PERC = ((Number of firms in industry - RANK of firm) / Number of firms in industry) x 100) |
|
Term |
Definition |
|---|---|
| Accepted / Declined / Compared between 46 minutes and 60 minutes | This is the total number of entries that were accepted / declined / compared by the Contra Firm between 46 minutes and 60 minutes after trade execution, for the selected month and year in the given time interval. |
| Firm % | This is the percentage of entries that were accepted / declined / compared by the Contra Firm between 46 minutes and 60 minutes after execution for the selected MP for the selected month and year in the given time interval. (% ≥ 46 minutes ≤ 60 minutes = (Number ≥ 46 minutes ≤ 60 minutes / Total Contra Firm entries) x 100) |
| Peer Group | |
| Number in Population | This is the total number of MPs in the peer group for the selected month and year for the given time interval. |
| Average % | This is the percentage of entries that were accepted / declined / compared by the Contra Firm between 46 minutes and 60 minutes after execution among the firms in the selected MP's peer group for the selected month and year in the given time interval. (AVG % ≥ 46 minutes ≤ 60 minutes = (Sum of ≥ 46 minutes ≤ 60 minutes for all firms in the peer group in this time interval / Total Contra Firm entries for All Firms in Peer Group in this time interval) x 100) |
| Best % | This is the best (lowest) percentage of entries that were accepted / declined / compared by the Contra Firm between 46 minutes and 60 minutes after execution among the firms in the selected MP's peer group for the selected month and year in the given time interval. |
| Rank | This is the rank of the selected MP relative to other MPs in its peer group based on its percentage of entries that were accepted / declined / compared by the Contra Firm between 46 minutes and 60 minutes after execution for the selected month and year. The MPs are ranked in ascending order from the lowest percentage to the highest percentage. |
| Percentile | This is the selected MP's percentile (PERC), relative to its peers, for its percentage of entries that were accepted / declined / compared by the Contra Firm between 46 minutes and 60 minutes after execution for the selected month and year in the given time interval. This percentile is calculated by sorting or ranking the firms based on a percentage of entries that were accepted / declined / compared in by the Contra Firm between 46 minutes and 60 minutes after execution. Once the firms are ranked, the rank of the firm relative to its peers (RANK) can be determined, and the percentile (PERC) can be determined by dividing the firm's rank by the total number of firms being ranked. (PERC = ((Number of firms in peer group - RANK of firm) / Number of firms in peer group) x 100) |
| Industry | |
| Number in Population | This is the total number of MPs in the industry for the selected month and year for the given time interval. |
| Average % | This is the percentage of entries that were accepted / declined / compared by the Contra Firm between 46 minutes and 60 minutes after execution among the firms in the industry for the selected month and year in the given time interval. (AVG % ≥ 46 minutes ≤ 60 minutes = (Sum of ≥ 46 minutes ≤ 60 minutes for all firms in the industry group in this time interval / Total Contra Firm Entries for All Firms in Industry in this time interval) x 100) |
| Best % | This is the best (lowest) percentage of entries that were accepted / declined / compared by the Contra Firm between 46 minutes and 60 minutes after execution among the firms in the industry for the selected month and year in the given time interval. |
| Rank | This is the rank of the selected MP relative to other MPs in the industry based on its percentage of entries that were accepted / declined / compared by the Contra Firm between 46 minutes and 60 minutes after execution for the selected month and year. The MPs are ranked in ascending order from the lowest percentage to the highest percentage. |
| Percentile | This is the selected MP's percentile (PERC), relative to other MPs in the industry, for its percentage of entries that were accepted / declined / compared by the Contra Firm between 46 minutes and 60 minutes after execution for the selected month and year in the given time interval. This percentile is calculated by sorting or ranking the firms based on a percentage of entries that were accepted / declined / compared by the Contra Firm between 46 minutes and 60 minutes after execution. Once the firms are ranked, the rank of the firm relative to the (RANK) can be determined, and the percentile (PERC) can be determined by dividing the firm's rank by the total number of firms being ranked. (PERC = ((Number of firms in industry - RANK of firm) / Number of firms in industry) x 100) |
|
Term |
Definition |
|---|---|
| Accepted / Declined / Compared 61 minutes or more | This is the total number of entries that were accepted / declined / compared by the Contra Firm 61 minutes or more after trade execution, for the selected month and year in the given time interval. |
| Firm % | This is the percentage of entries that were accepted / declined / compared by the Contra Firm 61 minutes or more after execution for the selected MP for the selected month and year in the given time interval. (% ≥ 61 minutes = (Number ≥ 61 minutes / Total Contra Firm Entries) x 100) |
| Peer Group | |
| Number in Population | This is the total number of MPs in the peer group for the selected month and year for the given time interval. |
| Average % | This is the percentage of entries that were accepted / declined / compared by the Contra Firm 61 minutes or more after execution among the firms in the selected MP's peer group for the selected month and year in the given time interval. (AVG % ≥ 61 minutes = (Sum of ≥ 61 minutes for all firms in the peer group in this time interval / Total Contra Firm Entries for All Firms in Peer Group in this time interval) x 100) |
| Best % | This is the best (lowest) percentage of entries that were accepted / declined / compared by the Contra Firm 61 minutes or more after execution among the firms in the selected MP's peer group for the selected month and year in the given time interval. |
| Rank | This is the rank of the selected MP relative to other MPs in its peer group based on its percentage of entries that were accepted / declined / compared by the Contra Firm 61 minutes or more after execution for the selected month and year. The MPs are ranked in ascending order from the lowest percentage to the highest percentage. |
| Percentile | This is the selected MP's percentile (PERC), relative to its peers, for its percentage of entries that were accepted / declined / compared by the Contra Firm 61 minutes or more after execution for the selected month and year in the given time interval. This percentile is calculated by sorting or ranking the firms based on a percentage of entries that were accepted / declined / compared by the Contra Firm 61 minutes or more after execution. Once the firms are ranked, the rank of the firm relative to its peers (RANK) can be determined, and the percentile (PERC) can be determined by dividing the firm's rank by the total number of firms being ranked. (PERC = ((Number of firms in peer group - RANK of firm) / Number of firms in peer group) x 100) |
| Industry | |
| Number in Population | This is the total number of MPs in the industry for the selected month and year for the given time interval. |
| Average % | This is the percentage of entries that were accepted / declined / compared by the Contra Firm 61 minutes or more after execution among the firms in the industry for the selected month and year in the given time interval. (AVG % ≥ 61 minutes = (Sum of ≥ 61 minutes for all firms in the industry group in this time interval / Total Contra Firm Entries for All Firms in Industry in this time interval) x 100) |
| Best % | This is the best (lowest) percentage of entries that were accepted / declined / compared by the Contra Firm 61 minutes or more after execution among the firms in the industry for the selected month and year in the given time interval. |
| Rank | This is the rank of the selected MP relative to other MPs in the industry based on its percentage of entries that were accepted / declined / compared by the Contra Firm 61 minutes or more after execution for the selected month and year. The MPs are ranked in ascending order from the lowest percentage to the highest percentage. |
| Percentile | This is the selected MP's percentile (PERC), relative to other MPs in the industry, for its percentage of entries that were accepted / declined / compared by the Contra Firm 61 minutes or more after execution for the selected month and year in the given time interval. This percentile is calculated by sorting or ranking the firms based on a percentage of entries that were accepted / declined / compared by the Contra firm 61 minutes or more after execution. Once the firms are ranked, the rank of the firm relative to the (RANK) can be determined, and the percentile (PERC) can be determined by dividing the firm's rank by the total number of firms being ranked. (PERC = ((Number of firms in industry - RANK of firm) / Number of firms in industry) x 100) |
Detail Data
Detail Data for the Contra Executing Firm 20 Minute Compliance Report Cad provides a list of transactions in which your firm failed, as the Contra Firm to accept / decline / compare trades within 20 minutes after execution, in apparent violation of FINRA Rules 7230A(b) and/or 7330(b). The data is the underlying detail of the alerts contained in the Contra Executing Firm 20 Minute Compliance Report Card.
The table below provides a reference description for all of the terms found in the Contra Executing Firm 20 Minute Compliance Report Card Detail Data..
|
Term |
Definition |
|---|---|
| Market Center ID | Indicates the market center where the trade was reported.
|
| Report Date | Date the trade was reported to a FINRA Trade Reporting Facility. |
| Execution Date | Date the trade was executed. |
| Report Time | Time the trade was submitted to a Trade Reporting Facility. |
| Execution Time | Time the trade was executed. |
| Issue Symbol | Symbol representing the stock traded. |
| Market Class | The market classification of the issue symbol.
|
| Primary Reporting Firm | MPID of the firm that reported the Executing Party of the trade. |
| Reporting Firm | MPID of the firm that was the Executing Party of the trade. |
| Primary Executing Firm | Primary MPID of the firm that executed the trade. |
| Executing Firm | MPID of the firm that was the Executing Party of the trade. |
| Executing Firm Capacity | Capacity Code for the executing firm. |
| Buy/Sell/Cross | Buy / Sell / Cross indicator of the Executing Party of the trade.
|
| Execution Quantity | Number of shares traded. |
| Execution Price | Price at which the trade was executed. |
| Primary Contra Reporting Firm | Primary MPID of the Contra Reporting Firm. |
| Contra Reporting Firm | MPID of the Contra Reporting firm of the Party. |
| Primary Contra Executing Firm | Primary MPID of the firm that was the Contra Executing Party of the trade. |
| Contra Executing Firm | MPID of the Contra Executing Party of the trade. |
| Contra Executing Firm Capacity | Capacity Code for the Contra Executing Party of the trade. |
| Accept Time | Time the trade was accepted by the Contra Executing Party of the trade. |
| Decline Time | Time the trade was declined by the Contra Executing Party of the trade. |
| Contra Report Time | Time the Contra Executing Party submitted its side of the trade. |
| Contra Execution Time | Time the Contra Executing Party identified when the trade was executed. |
| Assumed Execution Time | This is the earliest time when comparing the trade Execution Time, Contra Report Time, and Contra Execution Time |
| Published Trade Modifier 1 (Settlement Type) | Settlement modifier entered by the firm when it reports the trade.
|
| Published Trade Modifier 2 (Reason for SEC Rule 611 Exception or Exemption) | Trade Through Exemption modifier entered by the firm when it reports the trade.
|
| Published Trade Modifier 3 (Late/ Extended Hours) | Modifier used to identify when the trade was executed. This modifier can either be entered by the firm when it reports the trade or appended by the Trade Reporting Facility.
|
| Published Trade Modifier 4 (SRO Required Detail) | This identifier is a further classification of a trade with regard to SRO Required Detail. This modifier can either be entered by the firm or appended by the system.
|
| Carryover Flag | Denotes whether the trade transaction was carried over (not accepted / declined / compared by the contra firm on trade date, T+0) for processing.
|
| Special Trade Code | Identifies special and step-out trades.
|
| Trade Status | Trade Status Code as assigned by the Trade Reporting Facility.
|
| Media Report Flag | Identifies whether the trade was media reported or not (could differ from the Publish Indicator for odd lot trades).
|
| Media Report Eligible | Identifies whether the trade is media reportable or not (could differ from the Publish Indicator Flag for odd lot trades).
|
| Trade Source Code | This is an indicator identifying the electronic system on which the trade was executed or reported through.
|
| Trade Through Exempt Flag | Flag to identify trades that are trade through exempt.
|
| Clearing Flag | Denotes the clearing and matching specifications of the trade.
Trade Reporting Facility only:
|
| Reversal Flag | Denotes whether the trade report is a reversal transaction.
|
| TRF Control Number | Control Number Used for Interaction between Firms and TRF |
| Contra Firm Memo | This is the message appended by the contra firm to the Trade Reporting Facility entry. |
| PRP/Stop Stock Reference Time | The time at which the parties agree to the stop stock price or the prior reference time (i.e., the time currently required by FINRA rules). For example, for stop stock transactions, if the parties agree to the stop stock price at 10:00 a.m. and the trade is executed at 11:00 a.m., the trade detail report would reflect a “PRP/Stop Stock Reference Time” of 10:00 a.m. Similarly, for PRP transactions, if a firm executes a market-on-open order at 10:30 a.m., the trade detail report would reflect a “PRP/Stop Stock Reference Time” of 9:30 a.m. (the time the market opened). Please note – this time is only available starting with the January 2016 Report Card. |