Market Order Timeliness Report Card
The Market Order Timeliness (MOT) Report Card is a monthly status report based upon data reported to OATS detailing the number of customer market orders executed by your firm in NMS securities that were delayed in receiving a full execution in possible violation of both rules regarding full and prompt execution of customer market orders and the Best Execution rule. If non-compliance with these rules is found to exist, your firm may be found to be in violation of FINRA Rules 5310 and 5320. Firms should make no inference, however, that FINRA staff has or has not determined that the information contained on the Market Order Timeliness report card does or does not constitute rule violations.
Please note: the Market Order Timeliness Report Card was modified in 2013. The documentation below defines the new version of the this report. Documentation for the prior version of the Report Card can be obtained by contacting Report Center or Market Regulation staff.
Report Glossary
The tables below provide a reference description for all of the elements found in the Market Order Timeliness Report Card. (See Market Order Timeliness Figure 1 for a sample segment of the report.)
|
Term |
Definition |
|---|---|
| Headers of the MOT Report Card | |
| Market Category | The Market Category identifies whether you are viewing the Market Order Timeliness Report Card for the following types of securities:
|
| MPID | This is the Market Participant Identifier. |
| Peer Group (or Tier) | Each month, for every Market Category, the Report Card identifies four (4) Peer Groups (or Tiers) based upon each firm's respective number of Total Market Orders) during the selected month and year in the respective Market Category.
|
| Month/Year | This identifies the Month and Year during which the orders that you are viewing were executed. The MOT Report Card allows you to view certain of your firm's historical reports. |
| Values of the MOT Report Card | |
| Total Market Orders | This section of the report includes the total number of eligible market orders executed by your firm for the selected month and year in the respective Market Category. |
| Total Alerts | This section of the report includes the total number of MOT Alerts for your firm for the selected month and year in the respective Market Category. |
| Firm % of Total Alerts to Total Market Orders | This is the percentage of your firm's Total Alerts to its Total Market Orders during the period and related Market Category (i.e., Firm % of Total Alerts to Total Market Orders = (Total Alerts / Total Market Orders) X 100). |
| Number in Population | This is the total number of MPIDs in the respective Peer Group or Industry population for the selected month and year. |
| Straight Average % | This is the sum of all of the 'Firm %'s of Total Alerts to Total Market Orders' among the MPIDs in your firm's respective Peer Group or respective Industry Group in the given time interval and Market Category, divided by the total number of MPIDs in your firm's respective Peer Group or respective Industry Group in the given time interval and Market Category (i.e., Straight Average % = (Sum of Firm %'s of 'Total Alerts to Total Market Orders' for all firms in the respective Peer Group or Industry Group / Total Number of firms in the respective Peer Group or Industry Group) x 100). |
| Median % | This is the Firm % of Total Alerts to Total Market Orders of the firm that is in the middle among the member firms in your firm's respective Peer Group or in the respective Industry Group in the respective Market Category. |
| Rank | This is the rank of your firm relative to other MPIDs in your respective Peer Group or in the respective Industry Group based on each MPID's respective Firm % of Total Alerts to Total Market Orders' for the selected month and year in the respective Market Category. The MPIDs are ranked in ascending order from the lowest percentage to the highest percentage. In other words, the firm with the lowest Firm % of Total Alerts to Total Market Orders is ranked 1. If multiple firms have the same percentage, they all receive the same Rank. |
| Percentile | This is your firm's Percentile (PERC), relative to your firm's respective Peer Group or the respective Industry Group, for its Firm % of Total Alerts to Total Market Orders for the selected month and year in the respective Market Category. Once the firms are ranked, the percentile can be determined. (PERC = Number of Firms in the Peer Group or Industry population - RANK of Firm) / Number of Firms in respective Peer Group or Industry population) x 100). |
| Weighted Average % | This is the percentage of Total Alerts to Total Market Orders among the MPIDs in your firm's respective Peer Group or respective Industry Group in the given months and year and Market Category (i.e., Weighted Average % = (Total Alerts for all firms in the respective Peer Group or Industry Group / Total Transactions for all firms in the respective Peer Group or Industry Group) x 100). |
| Industry Group | Each month, for every Market Category, the Report Card contains certain data for the Industry Group (e.g., all firms that executed at least 1 Total Market Order in the respective Market Category) in an effort to provide some context to your firm's relative performance in the industry. |
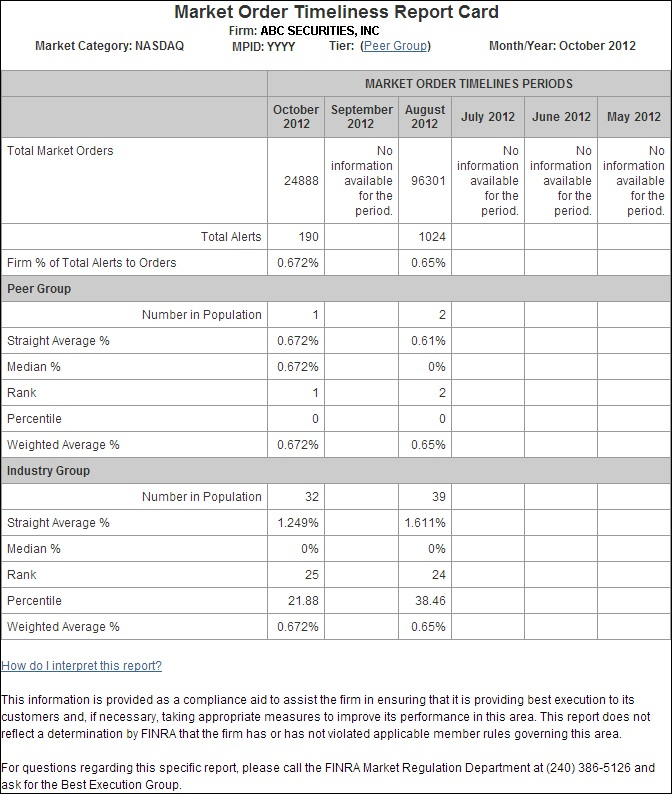
Market Order Timeliness Report Card Figure 1
Detail Data
Detail Data for the Market Order Timeliness Report Card provides a list of market orders executed by your firm that received a delayed execution in possible violation of both the rule regarding full and prompt execution of customer market orders and the Best Execution rule.
The data is the underlying detail of the alerts contained in the monthly Market Order Timeliness Report Card.
The table below provides a reference description for all of the elements found in the Market Order Timeliness Report Card Detail Data.
| Term | Definition |
|---|---|
| OATS Processing Date | This represents the OATS Business Day on which OATS data was received and processed by OATS. For example, a firm's OATS report with an event timestamp from Monday's OATS Business Day that doesn't get reported until Thursday's OATS Business Day will have an OATS Processing Date equal to Thursday's OATS Business Day. |
| Order Received Date | This is the date the market order was received by the firm. |
| P-MPID | This is the Primary MPID of the executing firm. |
| MPID | This is the MPID of the firm executing the trade. |
| Order Received Time | This is the time the order was received by the firm. |
| Order to B/S | This is the Buy/Sell indicator of the market order received by the firm. Values are:
|
| Order Quantity | This is the order share quantity. |
| Issue Symbol | This is the symbol of the issue. |
| Firm Order Id | This is the order identifier entered by the firm. |
| Execution Time | This is the time of the execution. For a market order that received more than one execution, this time will reflect the time of the latest of the executions related to such order. |
| Special Handling Code | Per the OATS technical Specifications, the code(s) listed here, if any are applicable to the respective order, will match the code listed in such specifications and will similarly be defined here as defined in such specifications. |
| Execution Price | This is the Order Execution Price of the last execution of the entered order. |
| Branch Sequence Number | This is the firm's internal order sequence number. |
| Routed Firm MPID | This is the firm that routed the order to the MPID (if applicable). |
| Desk Received Timestamp | This is the date and time the order was received by the trading desk from another desk or department. The alphanumeric string uses the format YYYYMMDDHHMMSS. |
| TMO Trigger Timestamp | This is the specific date and time that an order became a market order. The alphanumeric string uses the format YYYYMMDDHHMMSS. |
| Market Category | This is the market class in which the issue trades. Values are:
|