OATS Compliance Monthly Report Card
The OATS Compliance Report Card is a monthly status report on the number and percentage of:
- OATS Late Submissions;
- Out of Sequence Events;
- Unmatched Execution Reports;
- Unmatched Exchange Route Reports;
- Unmatched Interfirm Route Reports;
- Unmatched Interfirm Routes Received; and
- Unrepaired Repairable Rejected Order Events.
Member firms are required to submit Reportable Order Events ("ROEs") to OATS in accordance with established member rules and regulations. If your firm engages in a pattern or practice of late OATS reporting or improperly reporting order events, the firm may be found to be in violation of FINRA Rule 2010 and applicable OATS rules. Firms should make no inference, however, that FINRA staff has or has not determined that the information contained on the OATS Compliance report cards does or does not constitute rule violations.
The OATS Compliance report card will be made available through the Report Center approximately eight business days after the end of a report period. The report card will contain all daily OATS statistics for the prior month, along with industry and peer group comparisons and detail data. Users with Equity Report access who have not opted out of email notifications will receive an email once the report card has been published.
Effective October 17th, OATS was expanded to cover all NMS Stocks. In conjunction with this change the OATS Report Card was updated to allow users to see the OATS report cards for specific Market Categories. In addition to the previously available ability to view all of the report card activity, users now have the ability to filter the information (NASDAQ, CQS, Other).
Report Glossary
The tables below provide a reference description for all of the elements found in the OATS Compliance Report Card. (See OATS Compliance Report Card Figures 1 - 8 for a sample segment of the report.)
|
Term |
Definition |
|---|---|
| Industry | The industry consists of all market participants with at least one accepted ROE for the selected month and year. |
| MP | Market Participant |
| Tier Group | A tier group consists of firms within the same predetermined range of accepted ROEs, as identified in the table below: |
Beginning with the October 2012 Report Card and going forward, Tier values are based on the following range of numbers of accepted ROEs and a Tier value is assigned specific to each market category:
All Accepted ROE (All View)
| Tier Group | Number of Accepted ROEs |
|---|---|
| 1 | 100,000,000 or more |
| 2 | 3,000,000 - 99,999,999 |
| 3 | 100,000 - 2,999,999 |
| 4 | 10,000 - 99,999 |
| 5 | 0 - 9,999 |
NASDAQ Accepted ROE Only (NASDAQ View)
| Tier Group | Number of Accepted ROEs |
|---|---|
| 1 | 50,000,000 or more |
| 2 | 1,000,000 - 49,999,999 |
| 3 | 50,000 - 999,999 |
| 4 | 5,000 - 49,999 |
| 5 | 0 - 4,999 |
CQS Accepted ROE Only(CQS View)
| Tier Group | Number of Accepted ROEs |
|---|---|
| 1 | 100,000,000 or more |
| 2 | 3,000,000 - 99,999,999 |
| 3 | 100,000 - 2,999,999 |
| 4 | 10,000 - 99,999 |
| 5 | 0 - 9,999 |
OTC Accepted ROE Only (Other View)
| Tier Group | Number of Accepted ROEs |
|---|---|
| 1 | 500,000 or more |
| 2 | 25,000 - 499,999 |
| 3 | 5,000 - 24,999 |
| 4 | 500 - 4,999 |
| 5 | 0 - 499 |
For the Report Card including transactions reported from November 2011 through September 2012, Tier values were based on the following range of numbers of accepted ROEs and applied to all market categories:
All Accepted ROE (All View)
| Tier Group | Number of Accepted ROEs |
|---|---|
| 1 | 300,000,000 or more |
| 2 | 50,000,000 - 299,999,999 |
| 3 | 7,5000,000 - 49,999,999 |
| 4 | 50,000 - 7,499,999 |
| 5 | 0 - 49,999 |
NASDAQ Accepted ROE Only (NASDAQ View)
| Tier Group | Number of Accepted ROEs |
|---|---|
| 1 | 100,000,000 or more |
| 2 | 10,000,000 - 99,999,999 |
| 3 | 1,000,000 - 9,999,999 |
| 4 | 25,000 - 999,999 |
| 5 | 0 - 24,999 |
CQS Accepted ROE Only (CQS View)
| Tier Group | Number of Accepted ROEs |
|---|---|
| 1 | 200,000,000 or more |
| 2 | 25,000,000 - 199,999,999 |
| 3 | 5,000,000 - 24,999,999 |
| 4 | 25,000 - 4,999,999 |
| 5 | 0 - 24,999 |
OTC Accepted ROE Only (Other View)
| Tier Group | Number of Accepted ROEs |
|---|---|
| 1 | 1,000,000 or more |
| 2 | 50,000 - 999,999 |
| 3 | 5,000 - 49,999 |
| 4 | 500 - 4,999 |
| 5 | 0 - 499 |
For the Report Card including transactions reported from October 1 through October 31, 2011, Tier values were based on the following range of numbers of accepted ROEs and applied to all market categories:
| Tier Group | Number of Accepted ROEs |
|---|---|
| 1 | 100,000,000 or more |
| 2 | 10,000,000 - 99,999,999 |
| 3 | 100,000 - 9,999,999 |
| 4 | 10,000 - 99,999 |
| 5 | 0 - 9,999 |
For all Report Cards including transactions reported up until September 30, 2011, each Primary MPID was assigned a Tier value based on the following range of numbers of Reportable Order Events (ROEs) submitted to OATS:
| Tier Group | Number of Submitted ROEs |
|---|---|
| 1 | 3,333,334 or more |
| 2 | 333,334 to 3,333,333 |
| 3 | 33,334 to 333,333 |
| 4 | 3,334 to 33,333 |
| 5 | 1 to 3,333 |
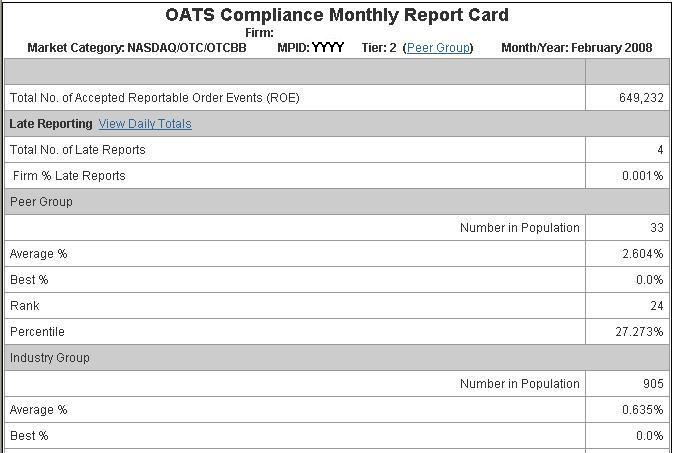
OATS Compliance Monthly Report Card Figure 1
|
Term |
Definition |
|---|---|
| Total No. of Accepted Reportable Order Events (ROE) | This is the total number of Reportable Order Events ("ROEs") accepted by the OATS system for the selected MP for the selected month and year. This number does not include unrepaired rejected ROEs. |
| Late Reporting | |
| Total No. of Late Reports | This is the total number of accepted ROEs marked late by OATS for the selected MP for the selected month and year. ROEs without a Rejected ROE Resubmit Flag of "Y" received after 8:00 a.m. (5:00 a.m. prior to October 17, 2011) the calendar day following the OATS business day on which the order event occurred, are marked late by OATS. |
| Firm % Late Reports | This is the percentage of late ROEs to total accepted ROEs for the selected MP for the selected month and year. |
| Peer Group | |
| Number in Population | This is the total number of MPs in the firm's peer group that had at least one accepted ROE for the selected month and year. |
| Average % | This is the percentage of late ROEs to total accepted ROEs among the firms in the selected MP's peer group for the selected month and year. (AVG Late % = (Total # Late ROEs for All Firms in Peer Group / Total # Accepted ROEs for All Firms in Peer Group) x 100) |
| Best % | This is the best (lowest) percentage of late ROEs to total accepted ROEs among the firms in the selected MP's peer group for the selected month and year. |
| Rank | This is the rank of the selected MP relative to other MPs in its peer group based on its percentage of late ROEs to total accepted ROEs for the selected month and year. The MPs are ranked in ascending order from the lowest percentage to the highest percentage. |
| Percentile | This is the selected MP's percentile (PERC), relative to its peers, for its percentage of late ROEs to total accepted ROEs for the selected month and year. This percentile is calculated by sorting or ranking the firms based on percentage of late ROEs. Once the firms are ranked, the percentile can be determined. A percentile of 100 represents the highest ranking and a percentile of 0 represents the lowest ranking. (Late PERC = ((Number of Firms in Peer Group - RANK of Firm) / Number of Firms in Peer Group) x 100) |
| Industry Group | |
| Number in Population | This is the total number of MPs in the industry group for the selected month and year. |
| Average % | This is the percentage of late ROEs to total accepted ROEs among the firms in the selected MP's industry group for the selected month and year. (AVG Late % = (Total # Late ROEs for All Firms in Industry Group / Total # Accepted ROEs for All Firms in Industry Group) x 100) |
| Best % | This is the best (lowest) percentage of late ROEs to total accepted ROEs among all participating member firms for the selected month and year. |
| Rank | This is the rank of the selected MP relative to other MPs in the industry based on its percentage of late ROEs to total accepted ROEs for the selected month and year. The MPs are ranked in ascending order from the lowest percentage to the highest percentage. |
| Percentile | This is the selected MP's percentile relative to the industry for its percentage of late ROEs to total accepted ROEs for the selected month and year. This percentile is calculated by sorting or ranking the firms based on percentage of late ROEs. Once the firms are ranked, the percentile can be determined. A percentile of 100 represents the highest ranking and a percentile of 0 represents the lowest ranking. (Late PERC = ((Number of Firms in Industry - RANK of Firm) / Number of Firms in Industry) x 100) |
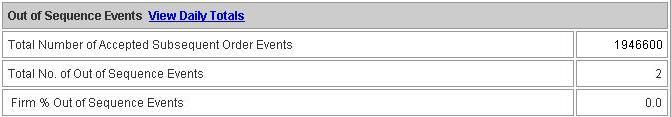
OATS Compliance Monthly Report Card Figure 2
| Out of Sequence Events | |
| Total No. of Subsequent Events | This is the total number of Subsequent Order Events (Route, Cancel, Execution, Desk, Cancel/Replace Reports) accepted by OATS for the selected MP for the selected month and year. |
| Total No. of Out of Sequence Events | This is the total number of accepted subsequent order events where the subsequent event's timestamp was earlier than the order receipt timestamp for the selected MP for the selected month and year. |
| Firm % of Out of Sequence Events | This is the percentage of out of sequence events to total accepted Subsequent Order Events for the selected MP for the selected month and year. |
| Peer Group | |
| Number in Population | This is the total number of MPs in the peer group for the selected month and year. |
| Average % | This is the percentage of out of sequence events to total accepted Subsequent Order Events among the firms in the selected MP's peer group for the selected month and year. (AVG OOS % = (Total # out of sequence events for all firms in Peer Group / Total # accepted Subsequent Order Events for all firms in Peer Group) x 100) |
| Best % | This is the best (lowest) percentage of out of sequence events to total accepted Subsequent Order Events among the firms in the selected MP's peer group for the selected month and year. |
| Rank | This is the rank of the selected MP relative to other MPs in its peer group based on its percentage of out of sequence events to total accepted Subsequent Order Events for the selected month and year. The MPs are ranked in ascending order from the lowest percentage to the highest percentage. |
| Percentile | This is the selected MP's percentile (PERC), relative to its peers, for its percentage of out of sequence events to total accepted Subsequent Order Events for the selected month and year. This percentile is calculated by sorting or ranking the firms based on percentage of out of sequence events. Once the firms are ranked, the percentile can be determined. A percentile of 100 represents the highest ranking and a percentile of 0 represents the lowest ranking. (OOS PERC = ((Number of Firms in Peer Group - RANK of Firm) / Number of Firms in Peer Group) x 100) |
| Industry Group | |
| Number in Population | This is the total number of MPs in the industry group for the selected month and year. |
| Average % | This is the percentage of out of sequence events to total accepted Subsequent Order Events among the firms in the selected MP's industry group for the selected month and year. (AVG OOS%= (Total # Out of Sequence Events for All Firms in Industry Group / Total # Accepted Subsequent Order Events for All Firms in Industry Group) x 100) |
| Best % | This is the best (lowest) percentage of out of sequence events to total accepted Subsequent Order Events among all participating member firms for the selected month and year. |
| Rank | This is the rank of the selected MP relative to other MPs in the industry based on its percentage of out of sequence events to total accepted Subsequent Order Events for the selected month and year. The MPs are ranked in ascending order from the lowest percentage to the highest percentage. |
| Percentile | This is the selected MP's percentile relative to the industry for its percentage of out of sequence events to total accepted Subsequent Order Events for the selected month and year. This percentile is calculated by sorting or ranking the firms based on percentage of out of sequence events (OOS %). Once the firms are ranked, the percentile can be determined. A percentile of 100 represents the highest ranking and a percentile of 0 represents the lowest ranking. (Late PERC = ((Number of Firms in Industry - RANK of Firm) / Number of Firms in Industry) x 100) |
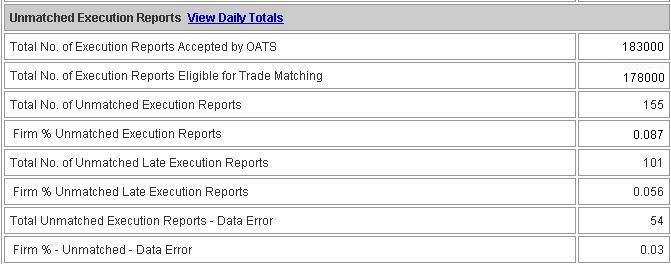
OATS Compliance Monthly Report Card Figure 3
|
Term |
Definition |
|---|---|
| Unmatched Execution Reports | In this section the term "Execution Reports" includes both Execution Reports and Combined Order/Execution Reports. |
| Total No. of Execution Reports | This is the total number of Execution Reports accepted by OATS for the selected MP for the selected month and year. |
| Total No. of Execution Reports Eligible for Trade Matching | This is the total number of Execution Reports accepted by OATS without a valid Reporting Exception Code and containing a Market Center ID of "D" (ADF), "DN" (FINRA/NYSE TRF), "L" (FINRA/NASDAQ TRF), or "O" (OTC Trade Reporting Facility) for the selected MP for the selected month and year ("DC"-FINRA NSX TRF included prior to October 17, 2011). |
| Total No. of Unmatched Execution Reports | This is the total number of Execution Reports that did not match to a related trade report in a FINRA Trade Reporting Facility ("TRF") for the selected MP for the selected month and year. This count includes only Execution Reports submitted to OATS without a valid Reporting Exception Code and containing a Market Center ID of "D" (ADF), "DN" (FINRA/NYSE TRF), "L" (FINRA/NASDAQ TRF), or "O" (OTC Trade Reporting Facility) that did not match to a related trade report ("DC"-FINRA NSX TRF included prior to October 17, 2011). |
| Firm % Unmatched Execution Reports | This is the percentage of unmatched Execution Reports to total Execution Reports eligible for TRF trade matching for the selected MP for the selected month and year. |
| Total No. of Late Execution Reports | This is the total number of Execution Reports that were submitted late and therefore could not be matched to a related trade report for the selected MP for the selected month and year. (NOTE: OATS attempts to match for the OATS Reporting Day when the report is received and if there is no match, OATS will attempt to match again on the next OATS Reporting Day. If after two days, OATS cannot find a corresponding trade record with the exact same values in these fields, the OATS report is considered to be unmatched.) |
| Firm % Unmatched Late Execution Reports | This is the percentage of unmatched late Execution Reports to total Execution Reports eligible for TRF trade matching for the selected MP for the selected month and year. |
| Total No. of Unmatched Execution Reports - Data Error | This is the total number of Execution Reports eligible for TRF trade matching where OATS was unable to match the Execution Report to the related trade report in a TRF for the selected MP for the selected month and year. These unmatched Execution Reports represent instances where the report was received by OATS within the two day match window, but could not be matched because one of the five fields required to match between OATS and the TRF was incorrect or missing in either the OATS Execution Report or the TRF trade report. |
| Firm % - Unmatched Execution Reports - Data Error | This is the percentage of Execution Reports that did not match, due to data error, to total Execution Reports eligible for TRF trade matching for the selected MP for the selected month and year. |
| Peer Group | |
| Number in Population | This is the total number of MPs in the firm's peer group that had at least one accepted Execution Report eligible for trade matching for the selected month and year. |
| Average % | This is the percentage of unmatched Execution Reports (including both late unmatched and data error unmatched) to total Execution Reports eligible for TRF trade matching among the firms in the selected MP's peer group for the selected month and year. (AVG Unmatched % = (Total # Unmatched Execution Reports for All Firms in Peer Group / Total # Execution Reports eligible for TRF trade matching for All Firms in Peer Group) x 100) |
| Best % | This is the best (lowest) percentage of unmatched Execution Reports to total Execution Reports eligible for TRF trade matching among the firms in the selected MP's peer group for the selected month and year. |
| Rank | This is the rank of the selected MP relative to other MPs in its peer group based on its percentage of unmatched execution reports to total Execution Reports eligible for TRF trade matching for the selected month and year. The MPs are ranked in ascending order from the lowest percentage to the highest percentage. |
| Percentile | This is the selected MP's percentile (PERC), relative to its peers, for its percentage of unmatched Execution Reports to total Execution Reports eligible for TRF trade matching for the selected month and year. This percentile is calculated by sorting or ranking the firms based on percentage of unmatched Execution Reports. Once the firms are ranked, the percentile can be determined. A percentile of 100 represents the highest ranking and a percentile of 0 represents the lowest ranking. (Unmatched PERC = ((Number of Firms in Peer Group - RANK of Firm) / Number of Firms in Peer Group) x 100) |
| Industry Group | |
| Number in Population | This is the total number of MPs in the industry group that had at least one accepted Execution Report eligible for trade matching for the selected month and year. |
| Average % | This is the percentage of unmatched Execution Reports (including both late unmatched and data error unmatched) to total Execution Reports eligible for TRF trade matching among the firms in the selected MP's industry group for the selected month and year. (AVG Unmatched %= (Total # Unmatched Execution Reports for All Firms in Industry Group / Total # Execution Reports Eligible for TRF Trade Matching for All Firms in Industry Group) x 100) |
| Best % | This is the best (lowest) percentage of unmatched Execution Reports to total Execution Reports eligible for TRF trade matching among all participating member firms for the selected month and year. |
| Rank | This is the rank of the selected MP relative to other MPs in the industry based on its percentage of total unmatched Execution Reports to total Execution Reports eligible for TRF trade matching for the selected month and year. The MPs are ranked in ascending order from the lowest percentage to the highest percentage. |
| Percentile | This is the selected MP's percentile relative to the industry for its percentage of unmatched Execution Reports to total Execution Reports eligible for TRF trade matching for the selected month and year. This percentile is calculated by sorting or ranking the firms based on percentage of unmatched Execution Reports (Unmatched %). Once the firms are ranked, the percentile can be determined. A percentile of 100 represents the highest ranking and a percentile of 0 represents the lowest ranking. (Unmatched PERC = ((Number of Firms in Industry - RANK of Firm) / Number of Firms in Industry) x 100) |
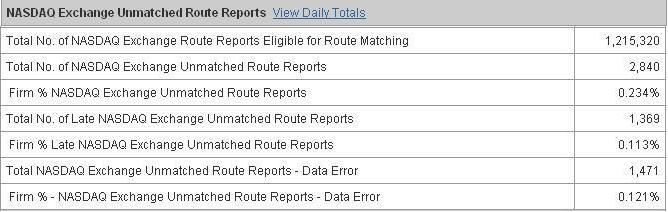
OATS Compliance Monthly Report Card Figure 4
|
Term |
Definition |
|---|---|
| Exchange Unmatched Route Reports | In this section the term "Route Report" includes both Route Reports and Combined Order/Route Reports. |
| Total No. of Exchange Route Reports Eligible for Route Matching | This is the total number of Route Reports accepted by OATS where the Destination Code is "XQ" (The NASDAQ Stock Market) and "XB" (NASDAQ OMX BX), "XX" (NASDAQ OMX PHLX), "XN" (New York Stock Exchange), "XA" (NYSE American); and "XP" (NYSE Arca) and the Routing Method Code is "E" (Electronic) or "S" (Smart Router) for the selected MP for the selected month and year. |
| Total No. of Exchange Unmatched Route Reports | This is the total number of Route Reports that did not match to a related order in an Exchange for the selected MP for the selected month and year. |
| Firm % Exchange Unmatched Route Reports | This is the percentage of unmatched Route Reports to total Route Reports eligible for Exchange route matching for the selected MP for the selected month and year. |
| Total No. of Late Exchange Unmatched Route Reports | This is the total number of Route Reports that were submitted more than one day late and therefore could not be matched to a related order in the the applicable exchange for the selected MP for the selected month and year. |
| Firm % Late Exchange Unmatched Route Reports | This is the percentage of unmatched late Route Reports to total Route Reports eligible for Exchange route matching for the selected MP for the selected month and year. |
| Total No. of Exchange Unmatched Route Reports - Data Error | This is the total number of Route Reports where OATS was unable to match the Route Report to the related order in the applicable exchange for the selected MP for the selected month and year. These unmatched Route Reports represent instances where the report was not more than one day late, but could not be matched because one of the four fields required to match between OATS and the applicable exchange was incorrect or missing in either the OATS Route Report or the applicable exchange order. |
| Firm % Exchange Unmatched Route Reports - Data Error | This is the percentage of Route Reports that did not match, due to data error, to total Route Reports eligible for Exchange route matching for the selected MP for the selected month and year. |
| Peer Group | |
| Number in Population | This is the total number of MPs in the firm's peer group for the selected month and year. |
| Average % | This is the percentage of unmatched Route Reports (including both late unmatched and data error unmatched) to total Route Reports eligible for Exchange route matching among the firms in the selected MP's peer group for the selected month and year. (AVG Unmatched Route % = (Total # Unmatched Route Reports for All Firms in Peer Group / Total # Route Reports eligible for Exchange route matching for All Firms in Peer Group) x 100) |
| Best % | This is the best (lowest) percentage of unmatched Route Reports to total Route Reports eligible for Exchange route matching among the firms in the selected MP's peer group for the selected month and year. |
| Rank | This is the rank of the selected MP relative to other MPs in its peer group based on its percentage of unmatched Route Reports to total Route Reports eligible for Exchange route matching for the selected month and year. The MPs are ranked in ascending order from the lowest percentage to the highest percentage. |
| Percentile | This is the selected MP's percentile (PERC), relative to its peers, for its percentage of unmatched Route Reports to total Route Reports eligible for Exchange route matching for the selected month and year. This percentile is calculated by sorting or ranking the firms based on percentage of unmatched Route Reports. Once the firms are ranked, the percentile can be determined. A percentile of 100 represents the highest ranking and a percentile of 0 represents the lowest ranking. (Unmatched Exchange PERC = ((Number of Firms in Peer Group - RANK of Firm) / Number of Firms in Peer Group) x 100) |
| Industry Group | |
| Number in Population | This is the total number of MPs in the industry group for the selected month and year. |
| Average % | This is the percentage of unmatched Route Reports to total Route Reports eligible for Exchange route matching among the firms in the selected MP's industry group for the selected month and year. (AVG Unmatched Route % = (Total # Unmatched Route Reports for All Firms in Industry Group / Total # Route Reports Eligible for Exchange Route Matching for All Firms in Industry Group) x 100) |
| Best % | This is the best (lowest) percentage of unmatched Route Reports to total Route Reports eligible for Exchange route matching among all participating member firms for the selected month and year. |
| Rank | This is the rank of the selected MP relative to other MPs in the industry based on its percentage of unmatched Route Reports to total Route Reports eligible for Exchange route matching for the selected month and year. The MPs are ranked in ascending order from the lowest percentage to the highest percentage. |
| Percentile | This is the selected MP's percentile relative to the industry for its percentage of unmatched Route Reports to total Route Reports eligible for Exchange route matching for the selected month and year. This percentile is calculated by sorting or ranking the firms based on percentage of unmatched Route Reports (Unmatched Exchange Route %). Once the firms are ranked, the percentile can be determined. A percentile of 100 represents the highest ranking and a percentile of 0 represents the lowest ranking. (Unmatched Exchange Route PERC = ((Number of Firms in Industry - RANK of Firm) / Number of Firms in Industry) x 100) |
OATS Compliance Monthly Report Card Figure 5
|
Term |
Definition |
|---|---|
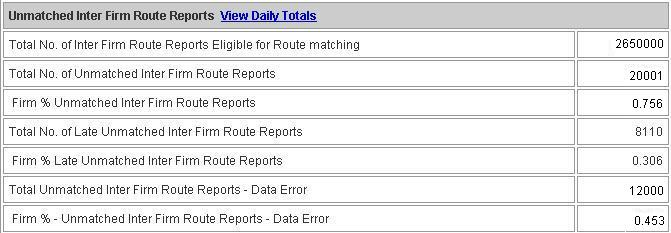
| Unmatched Interfirm Route Reports | In this section, the term "Route Report" includes both Route Reports and Combined Order/Route Reports. Please note that the Unmatched Inter firm Route Reports count on this report may be lower than what was published in the firm’s daily statistics on the OATS Production Website. This is because OATS attempts to match previously unmatched Route Reports for up to 30 days to new order events submitted by the receiving firm after the initial two day match window. Any unmatched Route Reports for which a subsequent match is found are removed from the Report Card statistics. The number of unmatched Route Reports that are caused by the sending firm reporting the Route Report beyond the two day match window will remain unchanged and appear as Late Unmatched Inter Firm Route Reports on the Report Card. |
| Total No. of Interfirm Route Reports Eligible for Route Matching | This is the total number of Route Reports accepted by OATS where the Destination Code is either "M" (member) or "E" (ECN) and the Routing Method Code is "E" (Electronic) or "S" (Smart Router) for the selected MP for the selected month and year. |
| Total No. of Unmatched Interfirm Route Reports | This is the total number of Interfirm Route Reports that did not match to a related new order submitted by the receiving firm for the selected MP for the selected month and year. |
| Firm % Unmatched Interfirm Route Reports | This is the percentage of unmatched Interfirm Route Reports to total Route Reports eligible for route matching for the selected MP for the selected month and year. |
| Total No. of Late Unmatched Interfirm Route Reports | This is the total number of Interfirm Route Reports that were submitted late and therefore could not be matched to a related new order submitted by the receiving firm for the selected MP for the selected month and year. |
| Firm % Late Unmatched Interfirm Route Reports | This is the percentage of unmatched late Interfirm Route Reports to total Route Reports eligible for route matching for the selected MP for the selected month and year. |
| Total No. of Unmatched Interfirm Route Reports - Data Error | This is the total number of Interfirm Route Reports where OATS was unable to match the Route Report to the related new order submitted by the receiving firm for the selected MP for the selected month and year. These unmatched Interfirm Route Reports represent instances where the report was received by OATS within the two day match window, but could not be matched because one of the fields required to match between the sending firm's route report and the receiving firm's New Order Report was incorrect or missing in either the route report or the related New Order Report. |
| Firm % Unmatched Interfirm Route Reports - Data Error | This is the percentage of Interfirm Route Reports that did not match, due to data error, to total Route Reports eligible for route matching for the selected MP for the selected month and year. |
| Peer Group | |
| Number in Population | This is the total number of MPs in the firm's peer group that had at least one accepted Interfirm Route Report eligible for route matching for the selected month and year. |
| Average % | This is the percentage of unmatched Interfirm Route Reports (including both late unmatched and data error unmatched) to total Interfirm Route Reports eligible for route matching among the firms in the selected MP's peer group for the selected month and year. (AVG Unmatched Route % = (Total # Unmatched Interfirm Route Reports for All Firms in Peer Group / Total # Route Reports eligible for route matching for All Firms in Peer Group) x 100) |
| Best % | This is the best (lowest) percentage of unmatched Interfirm Route Reports to total Route Reports eligible for route matching among the firms in the selected MP's peer group for the selected month and year. |
| Rank | This is the rank of the selected MP relative to other MPs in its peer group based on its percentage of unmatched Interfirm Route Reports to total Route Reports eligible for route matching for the selected month and year. The MPs are ranked in ascending order from the lowest percentage to the highest percentage. |
| Percentile | This is the selected MP's percentile (PERC), relative to its peers, for its percentage of unmatched Interfirm Route Reports to total Route Reports eligible for route matching for the selected month and year. This percentile is calculated by sorting or ranking the firms based on percentage of unmatched Interfirm Route Reports. Once the firms are ranked, the percentile can be determined. A percentile of 100 represents the highest ranking and a percentile of 0 represents the lowest ranking. (Unmatched Interfirm PERC = ((Number of Firms in Peer Group - RANK of Firm) / Number of Firms in Peer Group) x 100) |
| Industry Group | |
| Number in Population | This is the total number of MPs in the industry group that had at least one accepted Interfirm Route Report eligible for route matching for the selected month and year. |
| Average % | This is the percentage of unmatched Interfirm Route Reports (including both late unmatched and data error unmatched) to total Route Reports eligible for route matching among the firms in the selected MP's industry group for the selected month and year. (AVG Unmatched Interfirm % = (Total # Unmatched Interfirm Route Reports for All Firms in Industry Group / Total # Route Reports Eligible for Route Matching for All Firms in Industry Group) x 100) |
| Best % | This is the best (lowest) percentage of unmatched Interfirm Route Reports to total Route Reports eligible for route matching among all participating member firms for the selected month and year. |
| Rank | This is the rank of the selected MP relative to other MPs in the industry based on its percentage of unmatched Interfirm Route Reports to total Route Reports eligible for route matching for the selected month and year. The MPs are ranked in ascending order from the lowest percentage to the highest percentage. |
| Percentile | This is the selected MP's percentile relative to the industry for its percentage of unmatched Interfirm Route Reports to total Route Reports eligible for route matching for the selected month and year. This percentile is calculated by sorting or ranking the firms based on percentage of unmatched Interfirm Route Reports (Unmatched Interfirm Route %). Once the firms are ranked, the percentile can be determined. A percentile of 100 represents the highest ranking and a percentile of 0 represents the lowest ranking. (Unmatched Interfirm Route PERC = ((Number of Firms in Industry - RANK of Firm) / Number of Firms in Industry) x 100) |
OATS Compliance Monthly Report Card Figure 6
|
Term |
Definition |
|---|---|
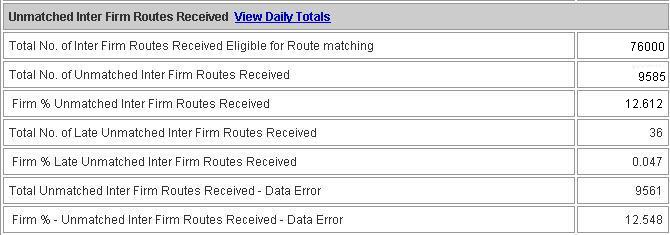
| Unmatched Interfirm Routes Received | |
| Total No. of Route Reports received by OATS where the selected MP is identified as the Sent To Firm MPID and the Route Report is Eligible for Route Matching | This is the total number of Route Reports accepted by OATS where the selected MP is identified as the Sent To Firm MPID and where the Destination Code is either "M" (member) or "E" (ECN) and the Routing Method Code is "E" (Electronic) or "S" (Smart Router) for the selected MP for the selected month and year. |
| Total No. of Unmatched Interfirm Routes Received | This is the total number of Interfirm Routes received that did not match to a related new order for the selected MP for the selected month and year. |
| Firm % Unmatched Interfirm Routes Received | This is the percentage of unmatched Routes received to total Routes received that were eligible for route matching for the selected MP for the selected month and year. |
| Total No. of Late Unmatched Interfirm Routes Received | This is the total number of Interfirm Routes received that were submitted late and therefore could not be matched to a related new order for the selected MP for the selected month and year. |
| Firm % Late Unmatched Interfirm Routes Received | This is the percentage of unmatched late Interfirm Routes received to total Route Reports eligible for route matching for the selected MP for the selected month and year. |
| Total No. of Unmatched Interfirm Routes Received - Data Error | This is the total number of Interfirm Routes received where OATS was unable to match the Route Report to the related new order for the selected MP for the selected month and year. These unmatched Interfirm Routes received represent instances where the route report was received by OATS within the two day match window, but could not be matched because one of the fields required to match between the sending firm's route report and the receiving firm's New Order Report was incorrect or missing in either the Route Report or the related New Order Report. |
| Firm % Unmatched Interfirm Routes Received - Data Error | This is the percentage of Interfirm Routes received that did not match, due to data error, to total Route Reports eligible for route matching for the selected MP for the selected month and year. |
| Peer Group | |
| Number in Population | This is the total number of MPs in the firm's peer group that had at least one accepted Interfirm Route received eligible for route matching for the selected month and year. |
| Average % | This is the percentage of unmatched Interfirm Routes received (including both late unmatched and data error unmatched) to total Interfirm Routes received eligible for route matching among the firms in the selected MP's peer group for the elected month and year. (AVG Unmatched Route % = (Total # Unmatched Interfirm Routes Received for All Firms in Peer Group / Total # Route Reports Eligible for Route Matching for All Firms in Peer Group) x 100) |
| Best % | This is the best (lowest) percentage of unmatched Interfirm Routes received to total Route Reports eligible for route matching among the firms in the selected MP's peer group for the selected month and year. |
| Rank | This is the rank of the selected MP relative to other MPs in its peer group based on its percentage of unmatched Interfirm Routes received to total Route Reports eligible for route matching for the selected month and year. The MPs are ranked in ascending order from the lowest percentage to the highest percentage. |
| Percentile | This is the selected MP's percentile (PERC), relative to its peers, for its percentage of unmatched Interfirm Routes received to total Route Reports eligible for route matching for the selected month and year. This percentile is calculated by sorting or ranking the firms based on percentage of unmatched Interfirm Routes received. Once the firms are ranked, the percentile can be determined. A percentile of 100 represents the highest ranking and a percentile of 0 represents the lowest ranking. (Unmatched Interfirm Routes Received PERC = ((Number of Firms in Peer Group - RANK of Firm) / Number of Firms in Peer Group) x 100) |
| Industry Group | |
| Number in Population | This is the total number of MPs in the industry group that had at least one accepted Interfirm Route received eligible for route matching for the selected month and year. |
| Average % | This is the percentage of unmatched Interfirm Routes received (including both late unmatched and data error unmatched) to total Route Reports eligible for route matching among the firms in the selected MP's industry group for the selected month and year. (AVG Unmatched Routes Received % = (Total # Unmatched Interfirm Routes Received for All Firms in Industry Group / Total # Route Reports Eligible for Route Matching for All Firms in Industry Group) x 100) |
| Best % | This is the best (lowest) percentage of unmatched Interfirm Routes received to total Route Reports eligible for route matching among all participating member firms for the selected month and year. |
| Rank | This is the rank of the selected MP relative to other MPs in the industry based on its percentage of unmatched Interfirm Routes received to total Route Reports eligible for route matching for the selected month and year. The MPs are ranked in ascending order from the lowest percentage to the highest percentage. |
| Percentile | This is the selected MP's percentile relative to the industry for its percentage of unmatched Interfirm Routes received to total Route Reports eligible for route matching for the selected month and year. This percentile is calculated by sorting or ranking the firms based on percentage of unmatched Interfirm Routes received (Unmatched Interfirm Routes Received %). Once the firms are ranked, the percentile can be determined. A percentile of 100 represents the highest ranking and a percentile of 0 represents the lowest ranking. (Unmatched Interfirm Routes Received PERC = ((Number of Firms in Industry - RANK of Firm) / Number of Firms in Industry) x 100) |
OATS Compliance Monthly Report Card Figure 7
|
Term |
Definition |
|---|---|
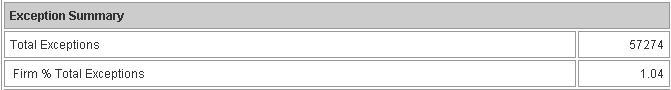
| Exceptions Summary | |
| Total Exceptions | This is the total number of late ROEs, out of sequence ROEs, unmatched execution reports - data error, unmatched Exchange Route Reports - data error and unmatched Interfirm Route Reports - data error. |
| Firm % Total Exceptions | This is the percentage of exceptions to the total accepted ROEs. Please note: To prevent one ROE from being counted as an exception more than once for purposes of overall percentage calculations, unmatched late execution reports, unmatched late Exchange Route Reports, unmatched late Interfirm Route Reports and unmatched late are not included as exceptions here because they are included in the count of late ROEs. |
| Peer Group | |
| Number in Population | This is the total number of MPs in the firm's peer group that had at least one accepted ROE for the selected month and year. |
| Average % | This is the percentage of exceptions to total accepted ROEs among the firms in the selected MP's peer group for the selected month and year. (AVG Exception % = (Total # Exceptions for All Firms in Peer Group / Total # Accepted ROEs for All Firms in Peer Group) x 100) |
| Best % | This is the best (lowest) percentage of exceptions to accepted ROEs among the firms in the selected MP's peer group for the selected month and year. |
| Rank | This is the rank of the selected MP relative to other MPs in its peer group based on its percentage of exceptions to total accepted ROEs for the selected month and year. The MPs are ranked in ascending order from the lowest percentage to the highest percentage. |
| Percentile | This is the selected MP's percentile (PERC), relative to its peers, for its percentage of exceptions to total accepted ROEs for the selected month and year. This percentile is calculated by sorting or ranking the firms based on percentage of exceptions. Once the firms are ranked, the percentile can be determined. A percentile of 100 represents the highest ranking and a percentile of 0 represents the lowest ranking. (Exception PERC = ((Number of Firms in Peer Group - RANK of Firm) / Number of Firms in Peer Group) x 100) |
| Industry Group | |
| Number in Population | This is the total number of MPs in the industry group that had at least one accepted ROE for the selected month and year. |
| Average % | This is the percentage of exceptions to total accepted ROEs among the firms in the selected MP's industry group for the selected month and year. (AVG Exception % = (Total # Exceptions for All Firms in Industry Group / Total # Accepted ROEs for All Firms in Industry Group) x 100) |
| Best % | This is the best (lowest) percentage of exceptions to accepted ROEs among all participating member firms for the selected month and year. |
| Rank | This is the rank of the selected MP relative to other MPs in the industry based on its percentage of exceptions to total accepted ROEs for the selected month and year. The MPs are ranked in ascending order from the lowest percentage to the highest percentage. |
| Percentile | This is the selected MP's percentile relative to the industry for its percentage of exceptions to total accepted ROEs for the selected month and year. This percentile is calculated by sorting or ranking the firms based on percentage of exceptions (Exception %). Once the firms are ranked, the percentile can be determined. A percentile of 100 represents the highest ranking and a percentile of 0 represents the lowest ranking. (Exception PERC = ((Number of Firms in Industry - RANK of Firm) / Number of Firms in Industry) x 100) |
OATS Compliance Monthly Report Card Figure 8
|
Term |
Definition |
|---|---|
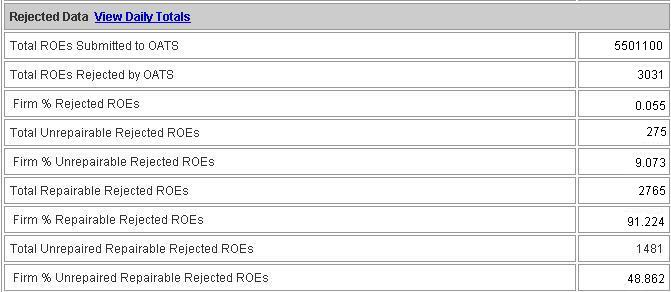
| Rejected Data | |
| Total ROEs Submitted to OATS | This is the total number of ROEs submitted to OATS, including unrepaired rejections, for the selected MP for the selected month and year. |
| Total ROEs Rejected by OATS | This is the total number of ROEs rejected by OATS for the selected MP for the selected month and year. |
| Firm % Rejected ROEs | This is the percentage of rejected ROEs to total ROEs submitted for the selected MP for the selected month and year. |
| Total Unrepairable Rejected ROEs | This is the total number of rejected ROEs that are not repairable for the selected MP for the selected month. This number includes all rejected ROEs with a Reject Reason Code of 2029 (Issue is not reportable to OATS) and 3501 (Duplicate Order Event). (See the OATS Reporting Technical Specifications, Appendix B for a list of all rejection reason codes.) |
| Firm % Unrepairable Rejected ROEs | This is the percentage of unrepairable rejections to total rejected ROEs for the selected MP for the selected month. |
| Total Repairable Rejected ROEs | This is the total number of repairable rejections for the selected MP for the selected month and year. This number includes all ROES that rejected for reasons other than Reject Reason Codes 2029 and 3501. (See the OATS Reporting Technical Specifications, Appendix B for a list of all rejection reason codes.) These rejections are repairable and therefore, should be repaired and resubmitted to OATS. |
| Firm % Repairable Rejected ROEs | This is the number of repairable rejections to total rejected ROEs for the selected MP for the selected month and year. |
| Total Unrepaired, Repairable Rejected ROEs | This is the total number of repairable rejections that were not repaired for the selected MP for the selected month and year. Please note: This number only includes repairable rejections not repaired by the 5th business day of the month following the processing month. (For example, repaired rejections for the month of January will only include rejections repaired by the 5th business day of February. Any rejections occurring in January, but repaired after the 5th business day of February will appear as unrepaired on the January report card.) |
| Firm % Unrepaired, Repairable Rejected ROEs | This is the percentage of unrepaired, repairable rejections to total repairable, rejected ROEs for the selected MP for the selected month and year. |
| Peer Group - Unrepaired Repairable Rejects | |
| Number in Population | This is the total number of MPs in the firm's tier group that had at least one repairable reject for the selected month and year. |
| Average % | This is the percentage of total unrepaired, repairable rejects to total repairable rejects among the firms in the selected MP's peer group for the selected month and year. (AVG URR % = (Total # Unrepaired Repairable Rejects for All Firms in Peer Group / Total # Repairable Rejects for All Firms in Peer Group) x 100) |
| Best % | This is the best (lowest) percentage of unrepaired, repairable rejects to total repairable rejects among the firms in the selected MP's peer group for the selected month and year. |
| Rank | This is the rank of the selected MP relative to other MPs in its peer group based on its percentage of total unrepaired, repairable rejects to total repairable rejects for the selected month and year. The MPs are ranked in ascending order from the lowest percentage to the highest percentage. |
| Percentile | This is the selected MP's percentile (PERC), relative to its peers, for its percentage of total unrepaired, repairable rejections to total repairable rejections for the selected month and year. This percentile is calculated by sorting or ranking the firms based on percentage of unrepaired repairable rejections. Once the firms are ranked, the percentile can be determined. A percentile of 100 represents the highest ranking and a percentile of 0 represents the lowest ranking. (URR PERC = ((Number of Firms in Peer Group - RANK of Firm) / Number of Firms in Peer Group) x 100) |
| Industry Group - Unrepaired Repairable Rejects | |
| Number in Population | This is the total number of MPs in the industry group that had at least one repairable reject for the selected month and year. |
| Average % | This is the percentage of unrepaired, repairable rejections to repairable rejections among the firms in the selected MP's industry group for the selected month and year. (AVG URR % = (Total # Unrepaired, Repairable Rejections for All Firms in Industry Group / Total # Repairable Rejections for All Firms in Industry Group) x 100) |
| Best % | This is the best (lowest) percentage of unrepaired, repairable rejections to repairable rejections among all participating member firms for the selected month and year. |
| Rank | This is the rank of the selected MP relative to other MPs in the industry based on its percentage of total unrepaired, repairable rejections to total repairable rejections for the selected month and year. The MPs are ranked in ascending order from the lowest percentage to the highest percentage. |
| Percentile | This is the selected MP's percentile relative to the industry for its percentage of unrepaired, repairable rejections to total repairable rejections for the selected month and year. This percentile is calculated by sorting or ranking the firms based on percentage of unrepaired, repairable rejections (Unrepaired %). Once the firms are ranked, the percentile can be determined. A percentile of 100 represents the highest ranking and a percentile of 0 represents the lowest ranking. (Unrepaired PERC = ((Number of Firms in Industry - RANK of Firm) / Number of Firms in Industry) x 100) |
|
Term |
Definition |
|---|---|
| Reporting Exception Code Usage | |
| Total No. of Execution Reports Accepted by OATS with a Reporting Exception Code | This is the total number of Execution Reports accepted for the MP that were submitted with a Reporting Exception Code. A Reporting Exception Code is added to an Execution Report to indicate that no related trade report was required to be submitted to a FINRA transaction reporting facility or where entry of a branch/sequence number is not possible (e.g. if the contra party on the trade report is not able to enter a branch/sequence number due to system constraints). Firms should closely monitor their usage of Reporting Exception Codes to ensure such codes are being reported appropriately. |
| Total % of Execution Reports Accepted by OATS with a Reporting Exception Code | This is the percentage of Execution Reports accepted for the MP that were submitted with a Reporting Exception Code. |
| Total No. of Execution Reports with Reporting Exception Code of 'A' | This is the total number of Execution Reports accepted for the MP that were submitted with a Reporting Exception Code of 'A' (Agency Average Price Transaction). |
| Firm % of Execution Reports with a Reporting Exception Code of 'A' | This is the percentage of Execution Reports accepted for the MP that were submitted with a Reporting Exception Code of 'A' (Agency Average Price Transaction). |
| Total No. of Execution Reports with Reporting Exception Code of 'T' | This is the total number of Execution Reports accepted for the MP that were submitted with a Reporting Exception Code of 'T' (Agency Post Trade Allocation). |
| Firm % of Execution Reports with a Reporting Exception Code of 'T' | This is the percentage of Execution Reports accepted for the MP that were submitted with a Reporting Exception Code of 'T' (Agency Post Trade Allocation). |
| Total No. of Execution Reports with Reporting Exception Code of 'M' | This is the total number of Execution Reports accepted for the MP that were submitted with a Reporting Exception Code of 'M'(Execution where entry of branch/sequence number is not possible). |
| Firm % of Execution Reports with a Reporting Exception Code of 'M' | This is the percentage of Execution Reports accepted for the MP that were submitted with a Reporting Exception Code of 'M' (Execution where entry of Branch/Sequence Number is not possible). |
| Total No. of Execution Reports with Reporting Exception Code of 'P' | This is the total number of Execution Reports accepted for the MP that were submitted with a Reporting Exception Code of 'P' (Intra-firm order filled from firm's proprietary account). |
| Firm % of Execution Reports with a Reporting Exception Code of 'P' | This is the percentage of Execution Reports accepted for the MP that were submitted with a Reporting Exception Code of 'P' (Intra-firm order filled from firm's proprietary account). |
| Total No. of Execution Reports with Reporting Exception Code of 'R' | This is the total number of Execution Reports accepted for the MP that were submitted with a Reporting Exception Code of 'R' (riskless principal transaction). |
| Firm % of Execution Reports with a Reporting Exception Code of 'R' | This is the percentage of Execution Reports accepted for the MP that were submitted with a Reporting Exception Code of 'R' (riskless principal transaction). |
| Total No. of Execution Reports with Reporting Exception Code of 'F' | This is the total number of Execution Reports accepted for the MP that were submitted with a Reporting Exception Code of 'F' (Reported on Form T pursuant to FINRA Trade Reporting Rules). |
| Firm % of Execution Reports with a Reporting Exception Code of 'F' | This is the percentage of Execution Reports accepted for the MP that were submitted with a Reporting Exception Code of 'F' (Reported on Form T pursuant to FINRA Trade Reporting Rules). |