Online Learning Report Cards
Continuing Education Regulatory Element Report
The CE Regulatory Element Report is published each quarter for any firm that has had at least one representative take a Regulatory Element CE session during the quarter. The report provides information about the firm's performance as well as industry performance during the quarter for comparison.
This report is produced on a quarterly basis within 30 days after the end of the quarter. Users who have a report to view and who have not opted out of notifications will receive an email indicating that new reports were published.
The table below provides a reference description for all of the elements found in the Continuing Education Regulatory Element Report.
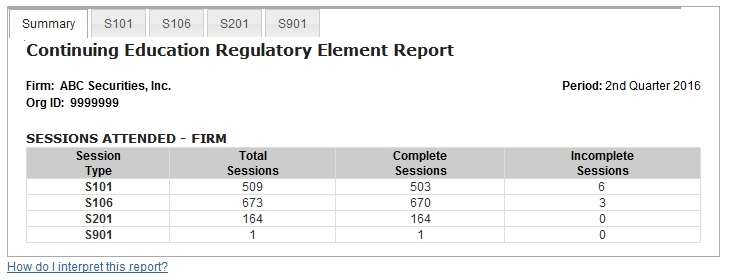
Sessions Attended - Firm (Summary Tab of the Report)
| Term | Description |
|---|---|
| Session Type | This shows which sessions were taken during the quarter by individuals at your firm. |
| Total Sessions | This is a count of the total number of each type of session that was taken by individuals at the firm during the quarter. |
| Complete Sessions | This is a count of the number of sessions of each type that were completed by individuals at your firm during the quarter. |
| Incomplete Sessions | This is the count of the number of sessions of each type that were taken by individuals at your firm but not completed. |
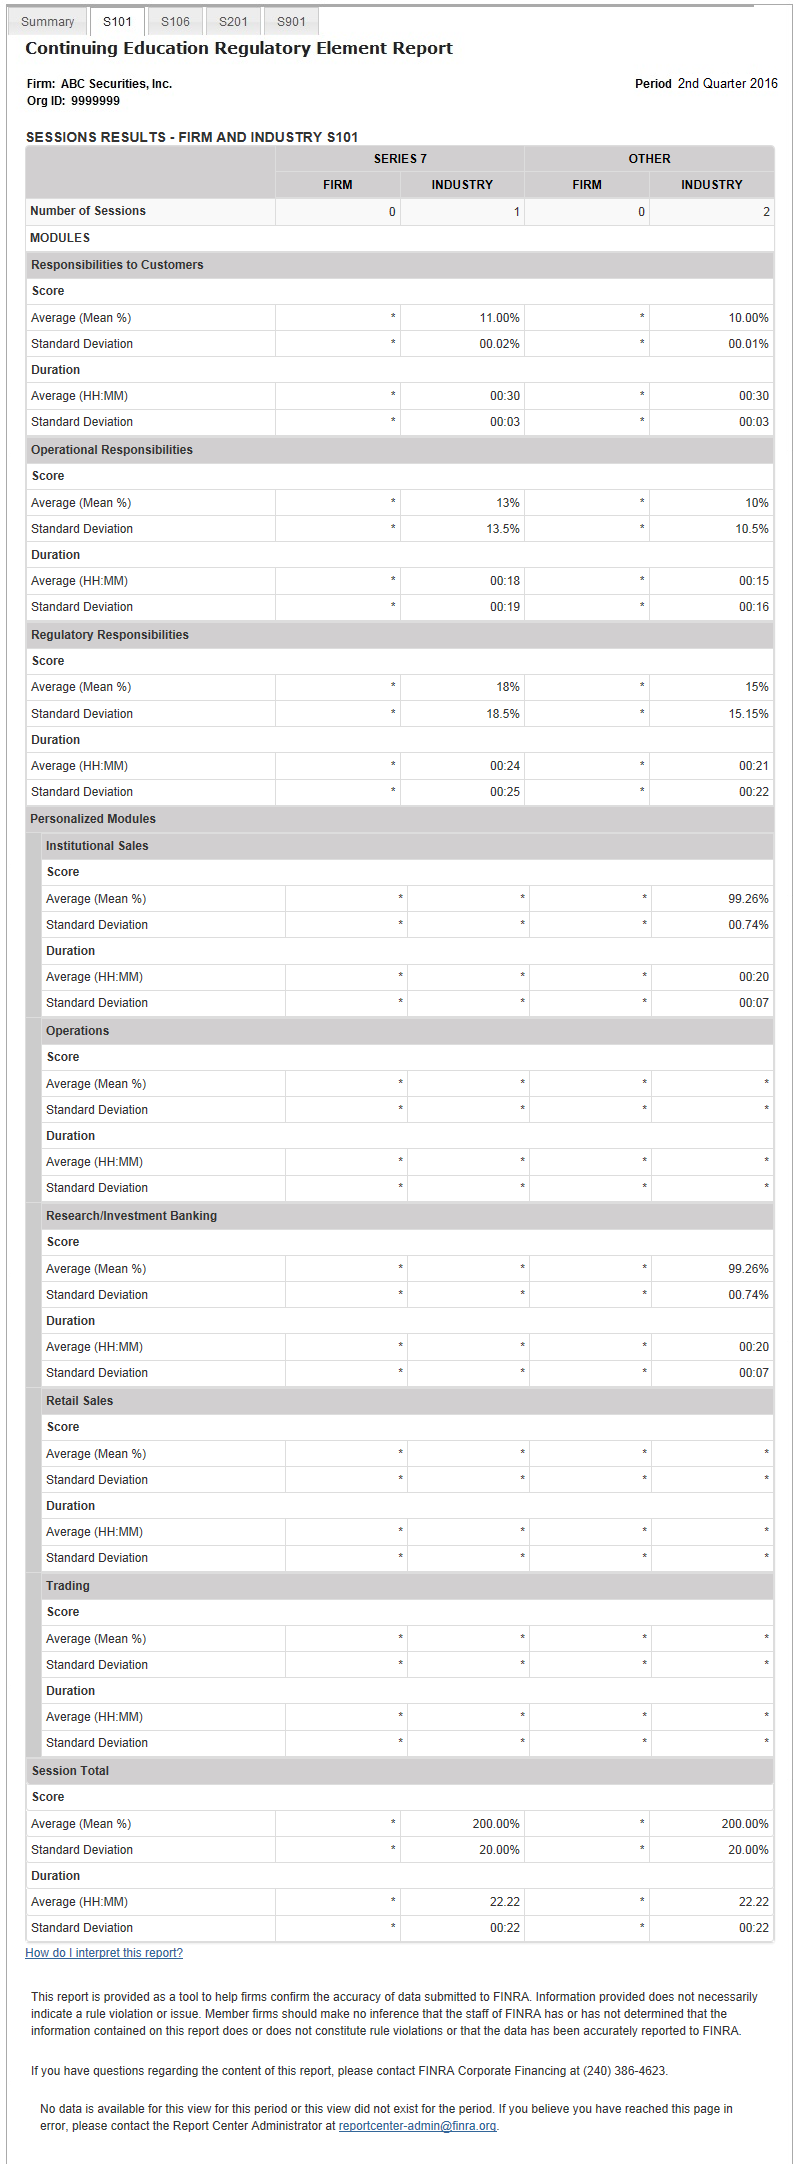
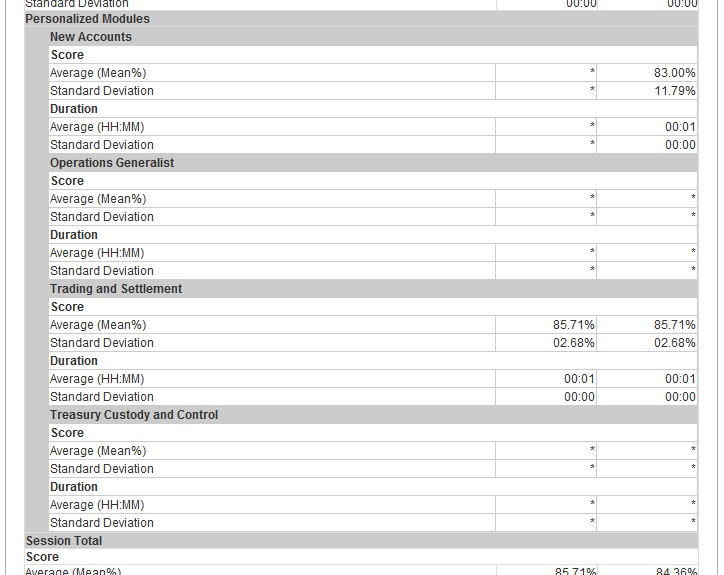
Session Results - Firm and Industry (Individual Tabs for each Session Type)
| Term | Description |
|---|---|
| Number of Sessions | This is the number of sessions of each type that were taken by individuals at your firm. The S101 tab separates performance by individuals who have a Series 7 registration and individuals who have registration categories other than the Series 7 ("Other"). |
| Firm | This column contains the score and duration for all sessions taken by individuals at your firm, for the particular type of CE session displayed in the tab selected at the top of the report. |
| Industry | The industry column is provided as information, for comparison purposes. The industry score and duration are derived from all sessions taken by individuals in the industry for each type of session. |
| Score - Average | This is the average score achieved by individuals of each registration type at your firm or in the industry for all sessions attended. |
| Score - Standard Deviation | The standard deviation measures how much variation there is in the scores from the average. A low standard deviation indicates that the scores achieved by the firm or industry tend to be very close to the average score. The higher the standard deviation, the more dispersed the scores are for the firm or industry. |
| Duration - Average | This is the average length of time spent on each module (for each session) by individuals of each registration type at your firm or in the industry for all sessions attended in an hours/minutes format. |
| Duration - Standard Deviation | The standard deviation measures how much variation there is in the time each individual needed to complete each module. A low standard deviation indicates that the time required by all individuals was relatively close to the average duration. The higher the standard deviation, the more dispersed the durations are for the firm or industry to complete each module. |
| Session Total | This section provides the overall average score and duration information for the whole session. |
Note: When a * symbol appears in this report it indicates that no data is available for this value. Asterisks appear for modules that do not apply and will also appear if your firm did not have representatives of each type attending sessions during the reporting quarter.