TRACE Corporate Bonds Daily Report Card
Overview
FINRA’s Trade Reporting and Compliance Engine (TRACE) collects, processes, and disseminates transaction data for corporate bonds and other fixed income securities to enhance market transparency and facilitate regulatory oversight. FINRA’s rules generally require members to report all eligible fixed income transactions to TRACE as soon as practicable, but no later than 15 minutes, while ensuring all transaction details are complete and accurate.
Historically, FINRA has provided a monthly report card of member firms’ corporate bonds transactions reported to TRACE. The report card provides key metrics related to trade reporting timeliness and compliance with TRACE requirements, allowing firms to monitor their compliance and identify potential areas of concern. This static report delivers a retrospective summary of the previous month’s transactions.
The new interactive TRACE Corporate Bonds Daily Report Card provides similar insights to the monthly report card but on a daily cadence and with an interactive interface. On a delayed daily basis, users can access and track and trend visualizations on key corporate bonds compliance metrics. In addition to interactive visualizations, users can export detailed data directly from the dashboard interface or set up machine-to-machine data sharing to interact with their in-house systems.
How It Works
The TRACE Corporate Bonds Interactive Report Card offers an interactive environment, allowing firms to identify potential issues with timely reporting of corporate bond transactions to TRACE. FINRA evaluates TRACE data by comparing reported transaction times against execution times to identify late reporting, analyzing execution time discrepancies between contra parties’ reports of the same trades, and detecting potential inaccuracies or failures to report that prevent proper trade matching between parties. Within the Interactive Report Card dashboard, a user can view interactive visualizations of their total number of valid corporate bond transactions, late reported trades, and inter-dealer trades. For inter-dealer trades, users can apply a time difference filter to focus on specific transactions based on a discrepancy in the execution times reported by their firm and the contra party in the same trade. Also, the Interactive Report Card provides a succinct heatmap of the firm’s performance against their peers in late reporting and contra execution reporting. The data provided through this Interactive Report Card is designed to assist firms in supervision of their corporate bond transaction reporting.
Each business day, on a delayed – trade date plus four business days (T+4) – basis, firms will be able to click on the Trading Market Code field and view data for all valid trades (“All”) or use filters to review Primary Market ("P1") or Secondary Market ("S1") valid trades reported to TRACE.
Features And Tools
As outlined in detail below, this Interactive Report Card has the following functionality:
- Control Panel Filters
- Track and Trend Visuals
- Export to CSV
- Self-Set Notifications
- Machine-to-Machine Daily Data Capabilities
- Export File Layouts
Control Panel Filters
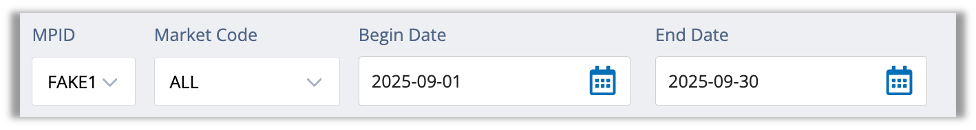
When you enter the TRACE Corporate Bonds Interactive Report Card, the top banner includes two drop-down selector fields (MPID and Trading Market Code) and two configurable date fields (Begin Date and End Date). The values in these fields drive the data available to the visualizations and tools in the remainder of the Interactive Report Card.
Market Participant Identifier (MPID)
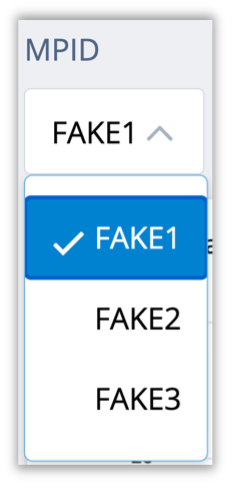
The first Control Panel drop-down selector field, MPID, provides the MPID(s) available to the member accessing the Interactive Report Card. Where a member has access to multiple MPIDs associated with the member firm, the MPID drop-down selector will permit the member to select a different MPID
Trading Market Code
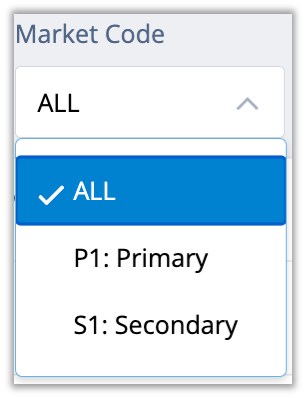
The second Control Panel drop-down selector field, Trading Market Code, permits members to narrow their review of TRACE reported trades to Primary Market ("P1") or Secondary Market ("S1"). The field defaults to “All”, which includes both P1 and S1 trades in the Interactive Report Card’s visualizations and tools.
Customizable Date Ranges
To the right of the MPID and Trading Market Code dropdown selectors in the Control Panel, the Interactive Report Card presents members with a selectable Begin Date and End Date. The default Begin Date is the first day of the previous full month and the Default End Date is the current date. For example, a member accessing the Interactive Report Card on Tuesday, October 14, 2025, would see a default Begin Date of September 1, 2025, and a default End Date of October 14, 2025. Members can adjust the date range to span across longer or shorter custom date ranges; this Interactive Report Card has data available back to January 1, 2025. The Begin and End Date dynamically drive the contents of interactive visualizations in the remainder of the Interactive Report Card
Track and Trend Visuals
Peer Ranking Heatmap
The visualization directly under the control panel is a monthly heatmap of your firm’s relevant Late Reporting and Contra-Execution Reporting activity within that month, ranked against firms within your peer group.
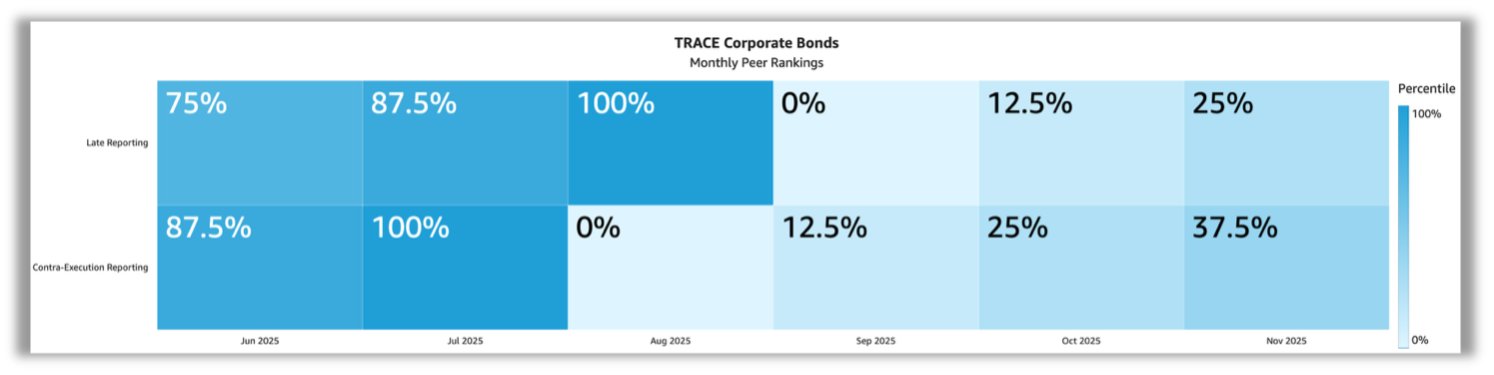
For each month where your firm has output, the heatmap shows your percentile rank within your peer group and color codes the percentile rank from low (fewer instances than those in your peer group) to high (greater instances than those in your peer group). By default, the previous six complete months are displayed. You can adjust the begin and end date filters to view different timeframes.
For this report card, peer groups are calculated based on the total number of valid transactions reported to TRACE during the relevant period, as outlined in the below table:
| TRACE Reporting Peer Group (by number of Valid Transactions) | |||||
|---|---|---|---|---|---|
Corporate Bond All View | Corporate Bond P1 View | Corporate Bond S1 View | |||
Peer Group | Number of Valid Trades | Peer Group | Number of Valid Trades | Peer Group | Number of Valid Trades |
1 | 11,000 or more | 1 | 1,000 or more | 1 | 10,000 or more |
2 | 2,700 - 10,999 | 2 | 200 - 999 | 2 | 2,500 to 9,999 |
3 | 500 - 2,699 | 3 | 1 - 199 | 3 | 500 - 2,499 |
4 | 1 - 499 | Not Applicable | 4 | 1 - 499 | |
Relevant Late Reporting instances are transactions that a member executed but reported greater than the allowable time after the time of execution. Contra-Execution Reporting instances are interdealer transactions where a member reports a trade with an execution time that was greater than 15 minutes after the contra party’s reported execution time.
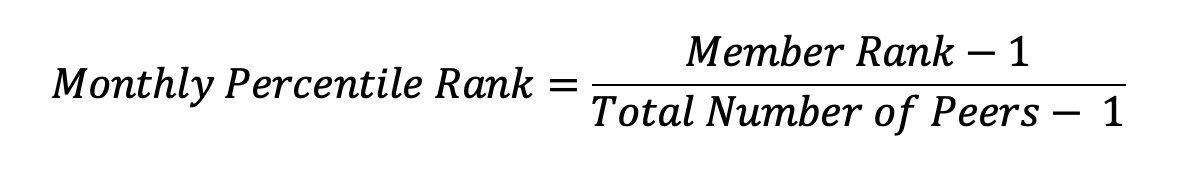
For each monthly period, the Peer Ranking Heatmap first ranks the total number of relevant instances (e.g., Late Reporting, Contra-Execution Reporting) recorded for a member during that month against the other members within that peer group. Then, the Peer Ranking heatmap converts that ranking into a percentile ranking from 0% (the lowest number of instances within a peer group) to 100% (the highest number of instances within a peer group) and displays that value in a color-coded tile reflecting the members relative performance during the month. Expressed as an equation, the monthly percentile rank appears as follows:
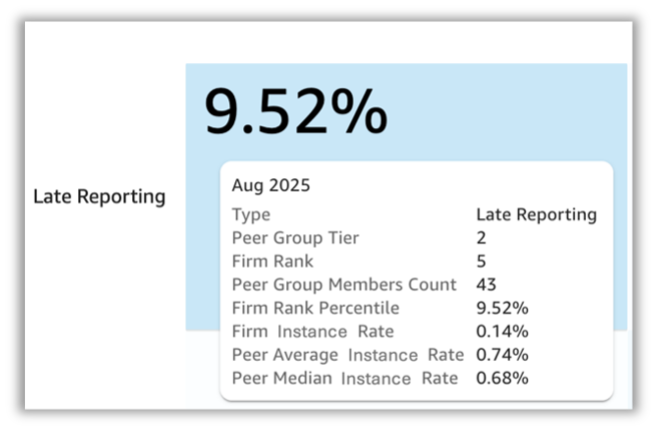
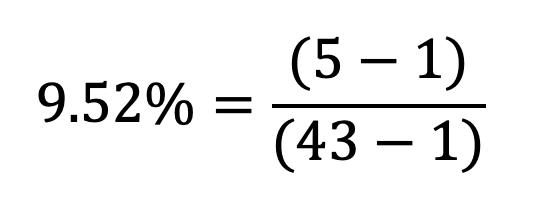
As an example, for August 2025, the above Peer Heatmap tile identifies member’s Late Reporting Activity as in the 9.52% percentile as compared to its peers. When you hover over the tile with your cursor, you can see the detail that underlies this calculation. Specifically, the member in the example is in Peer Group 2 and based on its Late Reporting instances for August 2025 ranked 5th out of a total 43 members in Peer Group 2. The Peer Ranking Heatmap Percentile Rank of 9.52% reflects the member’s rank (5) minus one, divided by the number of firms in the peer group (43) minus one:
Hovering over a Peer Heatmap tile also displays the following contextual data:
- Firm Instance Rate: the number of relevant instances (e.g., Late Reported Trades, Contra-Execution Reporting) divided by the total population for the metric (Total Valid Trades for Late Reporting, and all Inter-Dealer Trades for Contra-Execution Reporting)
- Peer Average Instance Rate: the average instance rate for firms within the relevant peer group.
- Peer Median Instance Rate: the median instance rate for firms within the relevant peer group.
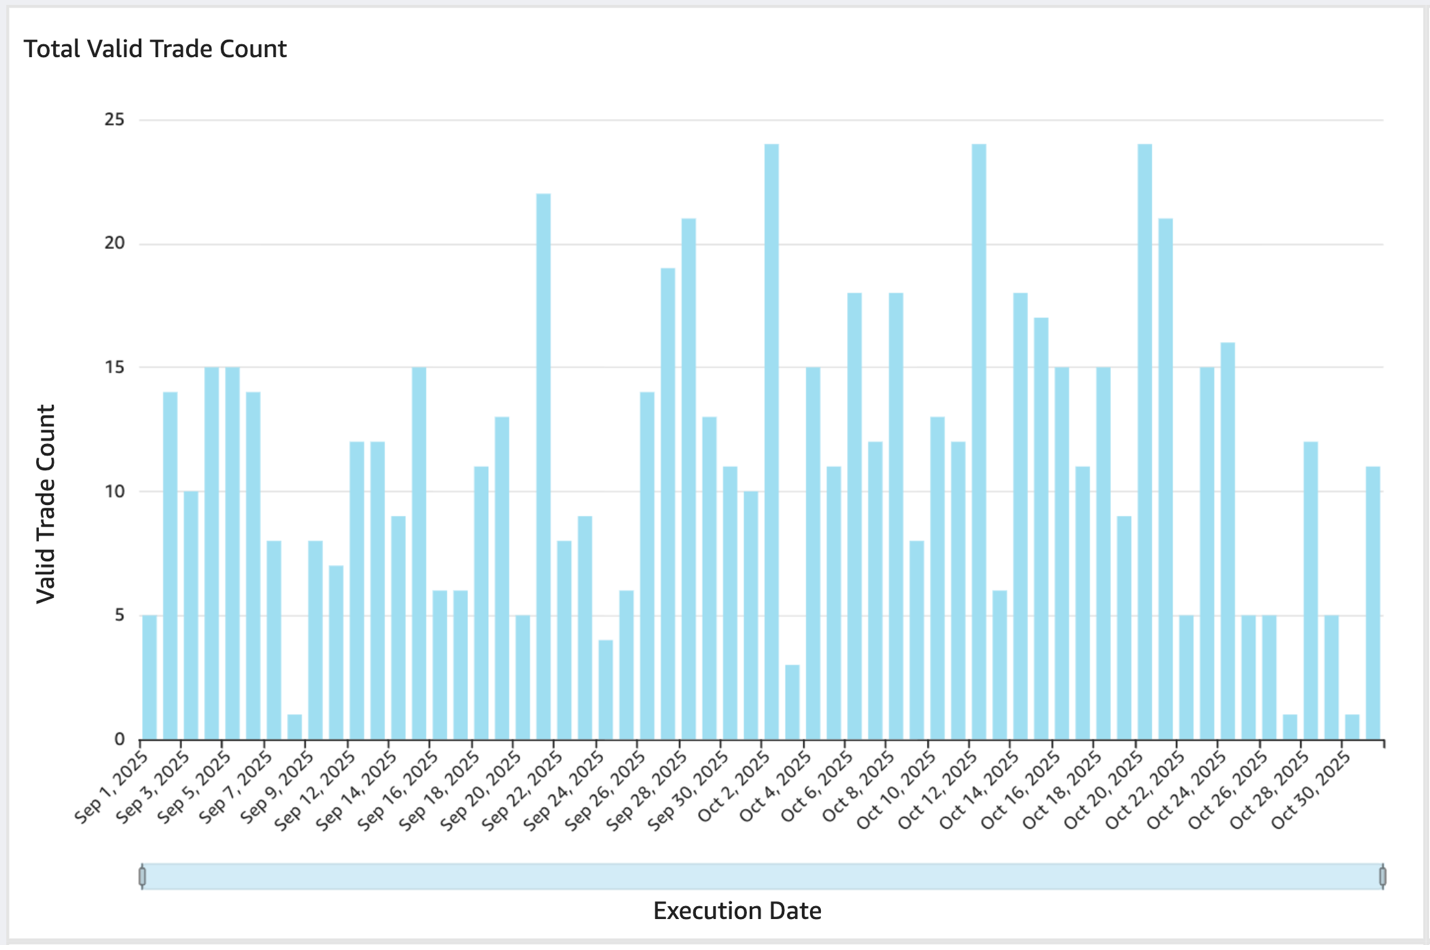
Total Valid Trade Count
The top left visualization under the Peer Ranking Heatmap displays the daily total valid trade count for the period selected. In this context, a valid trade is one reported and not cancelled at trade date plus three business days (T+3). Each trade is only represented once in this count; if a trade is submitted during the report month and then corrected once or more during T+3 period, that trade is still only counted once in the Total Valid Trade Counts.
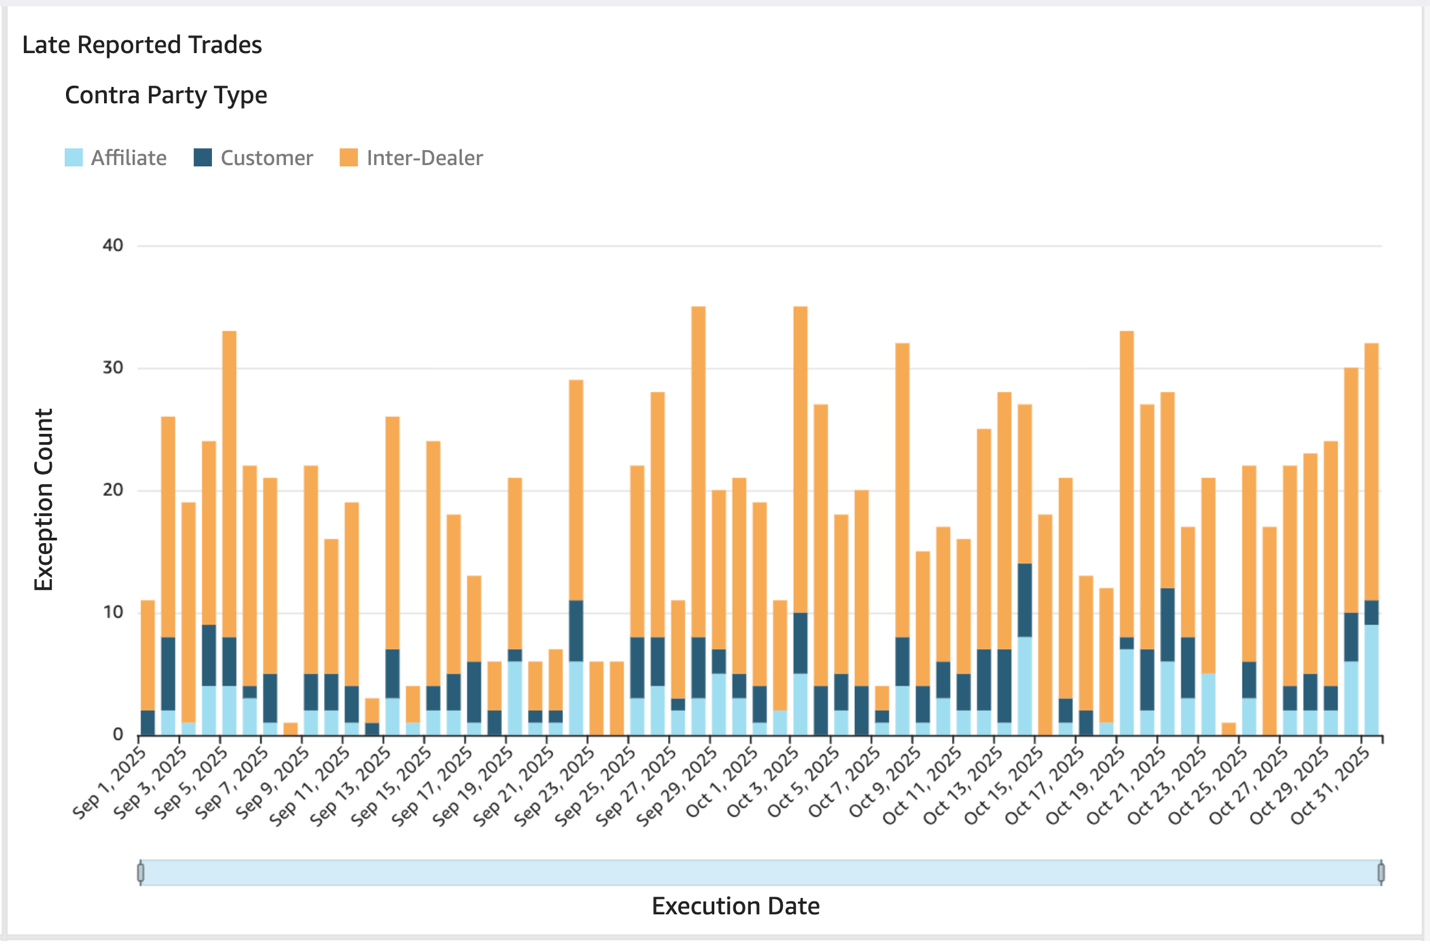
Late Reported Trades
The top right visualization under the Peer Ranking Heatmap displays the daily count of transactions that a member executed but reported greater than the allowable time after the time of execution (Late Reported Trades). Only valid trade reports are considered. The visualization also identifies the Contra Party Type: Affiliate; Customer; Inter-dealer.
Inter-dealer Trades
The Interactive Report Card provides insight into execution time differences between the member firms and their contra parties in the same transactions reported to TRACE. As a default, the Interactive Report Card visualizes inter-dealer trades where the execution time reported by a member firm is greater than 15 minutes after the contra party’s execution time in that same transaction reported to TRACE.
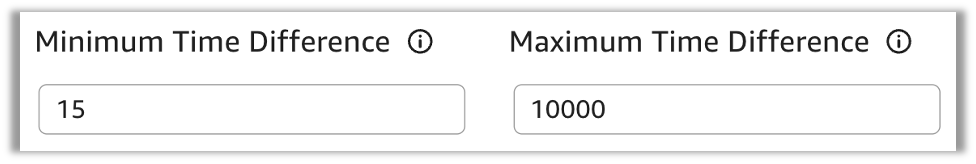
The Minimum Time Difference and Maximum Time Difference fields reflect the time difference in minutes between the contra party’s reported execution time and the member’s later reported execution time on the opposite side of the trade. These fields drive the two inter-dealer trade visualizations, one that displays the count of daily instances that meet the parameters and a second that displays the contra parties included in trades that meet the parameters. Users may customize the Minimum and Maximum Time Difference fields to broaden the inter-dealer trades included (e.g., including instances where the member’s execution time was prior to the contra party’s execution time by more than 15 minutes) or narrow the analysis to specific time difference slices (e.g., including instances where the member’s execution times were between 15 and 20 minutes after the contra parties’ execution times).
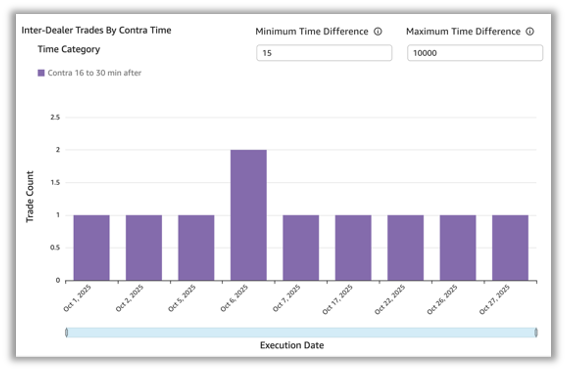
Inter-dealer Trades by Contra Time
The visualization on the left of the inter-dealer trades section shows a daily count of inter-dealer trades that are between the minimum and maximum time difference from the perspective of the member. For example, if a member reports a trade with an execution time that was 13 minutes after the contra party’s execution time, it will not appear in the below chart. If, however, a member reports a trade with an execution time that was 18 minutes after the contra party’s execution time, it will appear in the below chart.
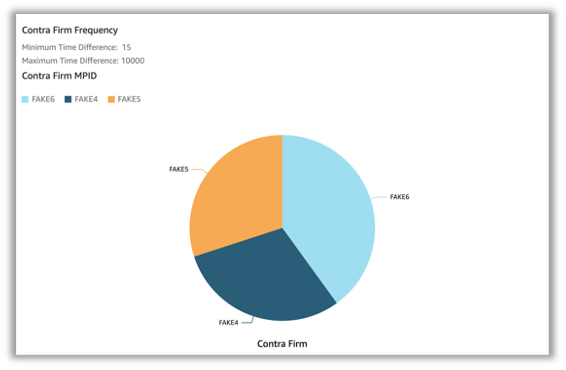
Inter-dealer Trades by Contra Firm Frequency
The visualization on the right of the inter-dealer trades section shows the inter-dealer contra parties as a share of total inter-dealer trades that are between the minimum and maximum time difference from the perspective of the member. This visualization serves to assist members in communicating internally and with contra parties regarding potential delays in their reporting.
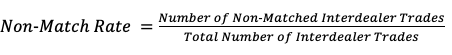
Non-Match Rate
The final visualization in the Interactive Report Card provides insight into the percentage of inter-dealer corporate bond trades that a member submitted to TRACE that did not match to a corresponding contra party trade report.
The non-match rate visualization shows a line graph with a data point for each day between the Begin and End Date. 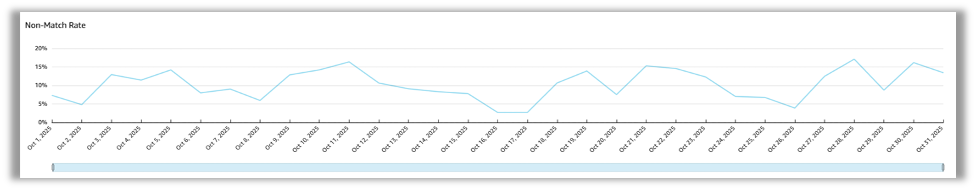
Export to CSV
The Export to CSV function facilitates member firm analysis outside the Interactive Report Card. For example, when facilitating internal root cause analysis or enriching report card data within additional member specific information to facilitate analysis.
To access the export to CSV function, please select the Export to CSV button at the top of the TRACE Corporate Bonds Interactive Report Card.
Once selected, a dialog box will appear showing the selected filters based on your current Control Panel settings. The Export Data dialogue box allows you to refine the data export by changing any of the configurable fields or deselecting individual data sets.
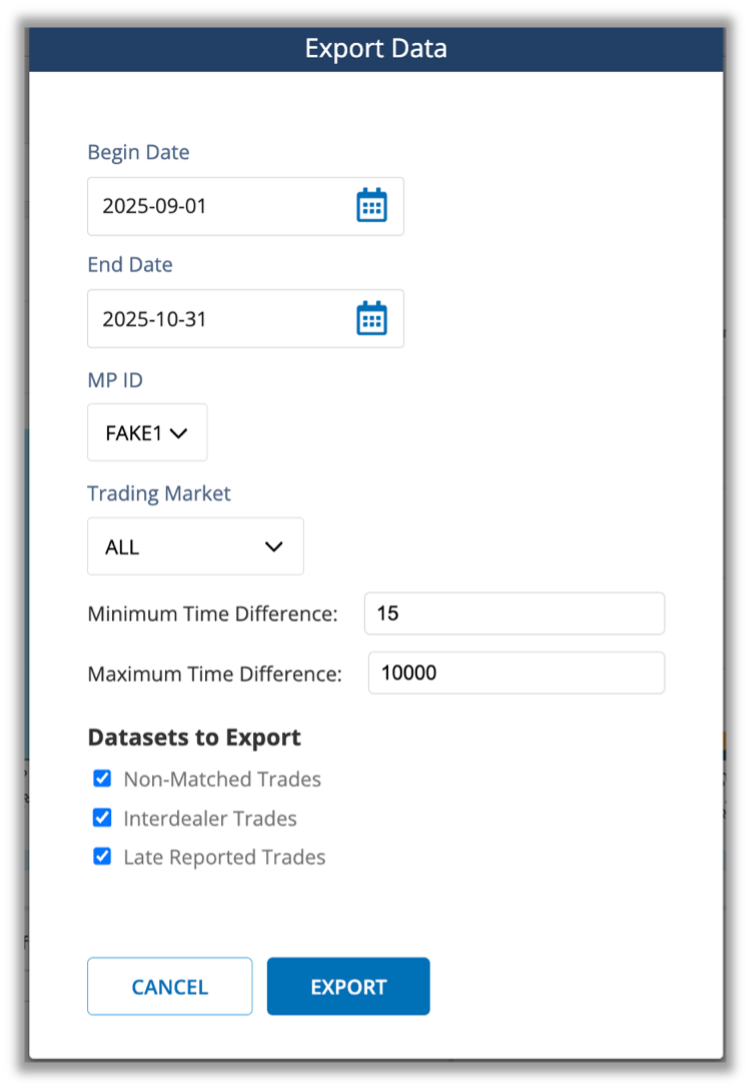
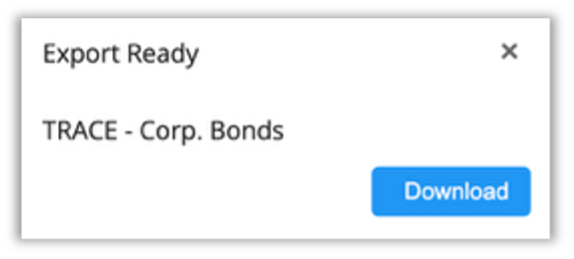
To download the datasets you have selected, click the Export button in the bottom right of the dialog box. You will see an Export Queued dialog in the bottom right of the screen. Once the processing is complete, select download to save a downloadable .zip file to your machine. These files are also available for download in the Exports tab after processing.
The download is a .zip folder that contains Comma Separated Value (CSV) files a “manifest” file that describes the details of the export (e.g., Begin Date, End Date, MPID, Trading Market Code); and files that correspond to the datasets you have selected to export (i.e., Non-Matched Trades, Inter-dealer Trades, Late Reported Trades). Please find the file layouts for these data sets [file layouts].
Self-Set Notifications
As a supplement to track and trend-visuals described above, FINRA offers a self-set notification feature that empowers individual users to customize when and how they engage with the Interactive Report Card based on their specific roles and needs.
How to Set Up Notifications
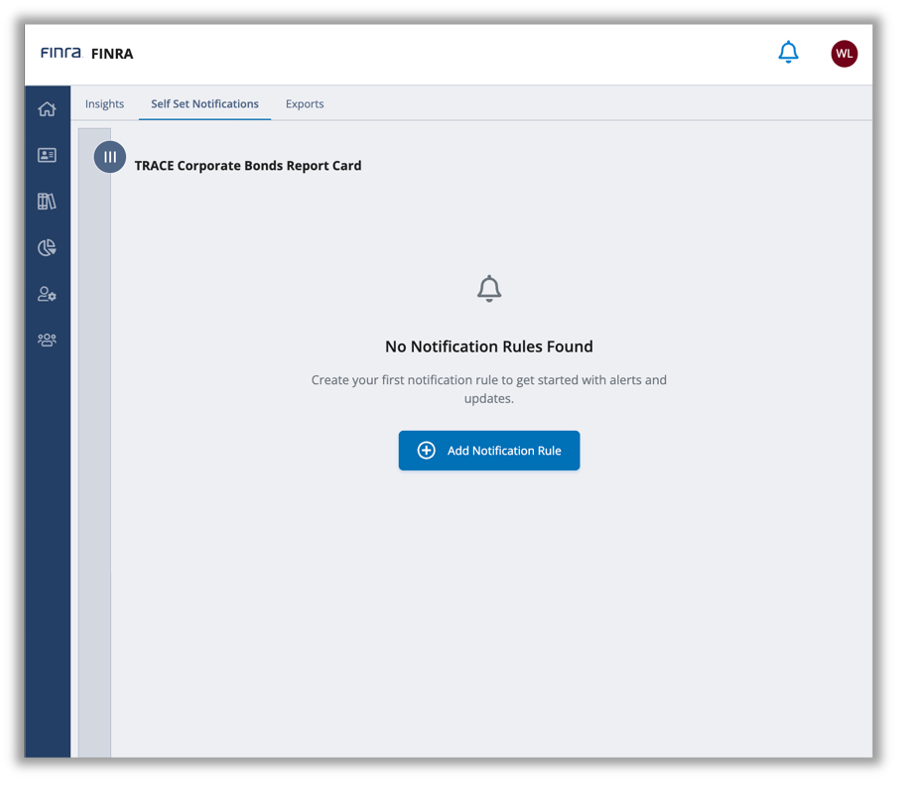
From within the TRACE Corporate Bonds Daily Report Card, navigate to “Self-Set Notifications” in the top banner and select “Add Notification Rule.”
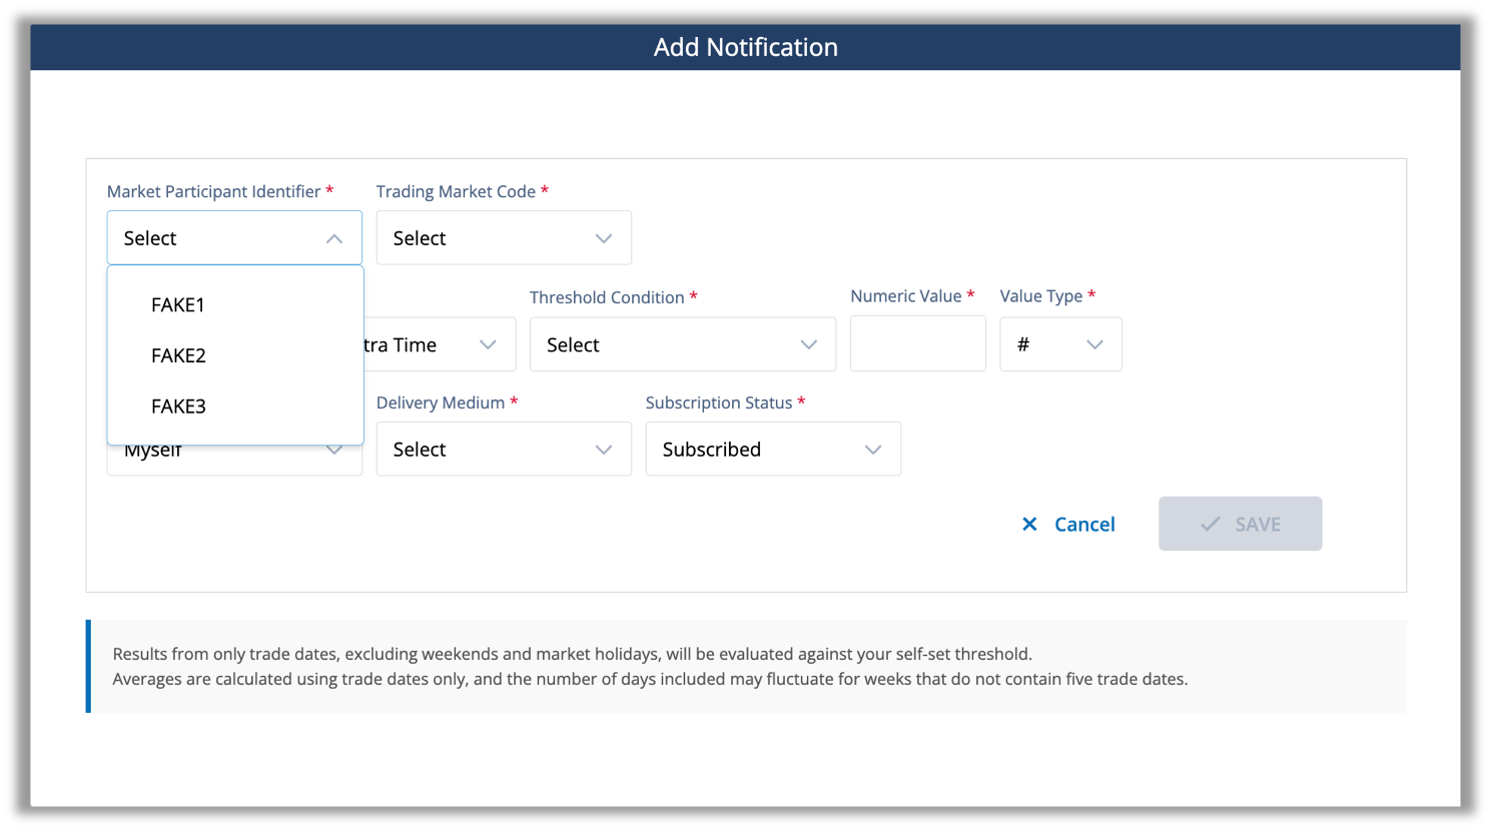
Once selected, a dialogue box will appear that allows you to configure a set of parameters (a “Rule”) that will result in FINRA sending a notification if the conditions of the Rule are met. The top line of the dialogue box prompts you to first select the firm Market Participant Identifier for which you would like to set a Rule.
Second, you must select the Trading Market Code (Primary Market ("P1") or Secondary Market ("S1") or both (“All”)) for which you would like to set a Rule.
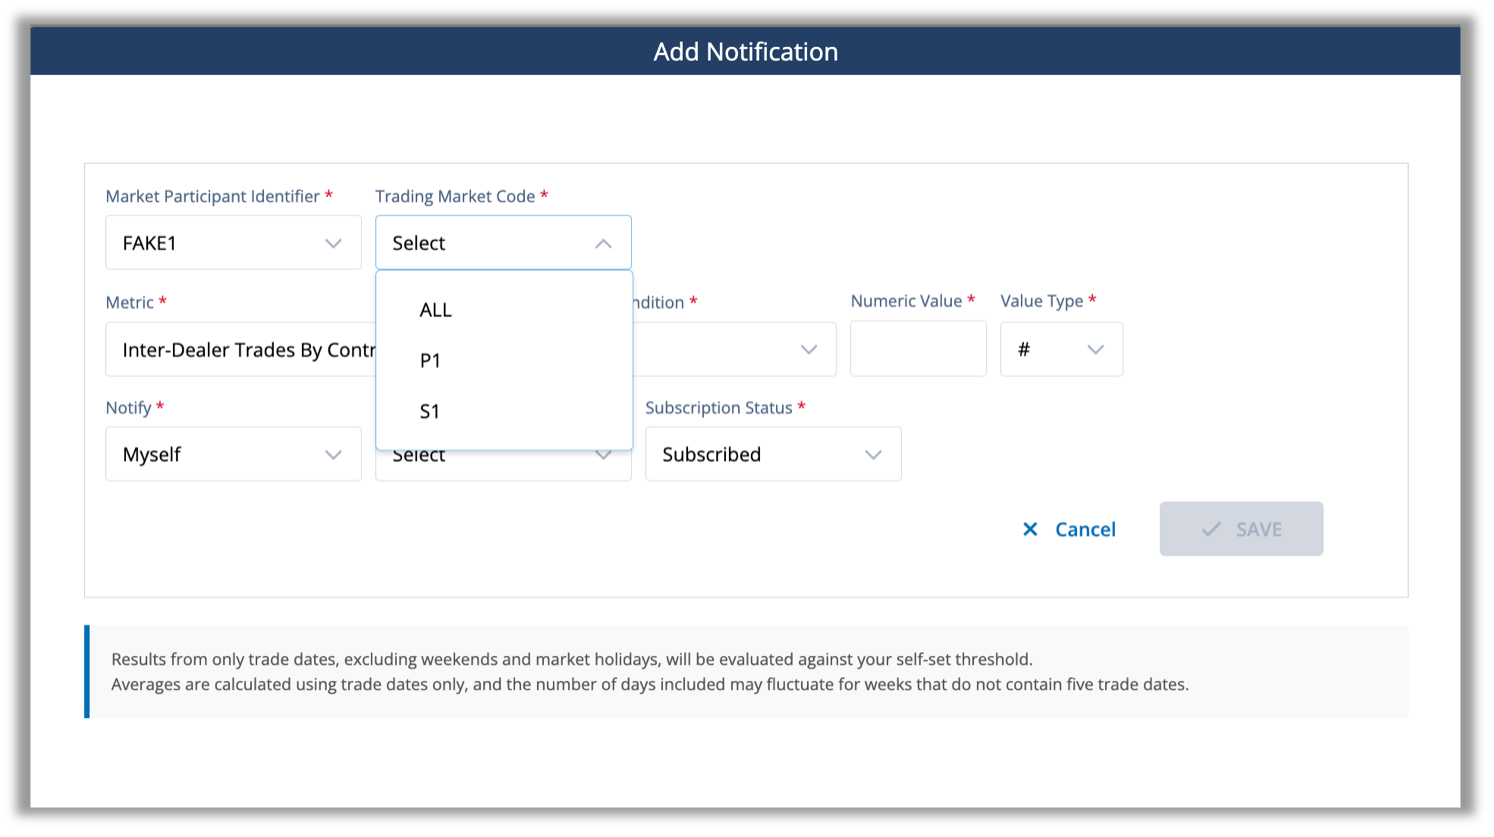
Once you have selected the relevant Market Participant Identifier and Trading Market Code, the first dialogue box on next line prompts you to select from four different TRACE Corporate Bonds Daily Report Card Metrics: (1) Inter-Dealer Trades By Contra Time; (2) Late Reported Trades; (3) Non-Match Rate; and (4) Total Valid Trade Count.
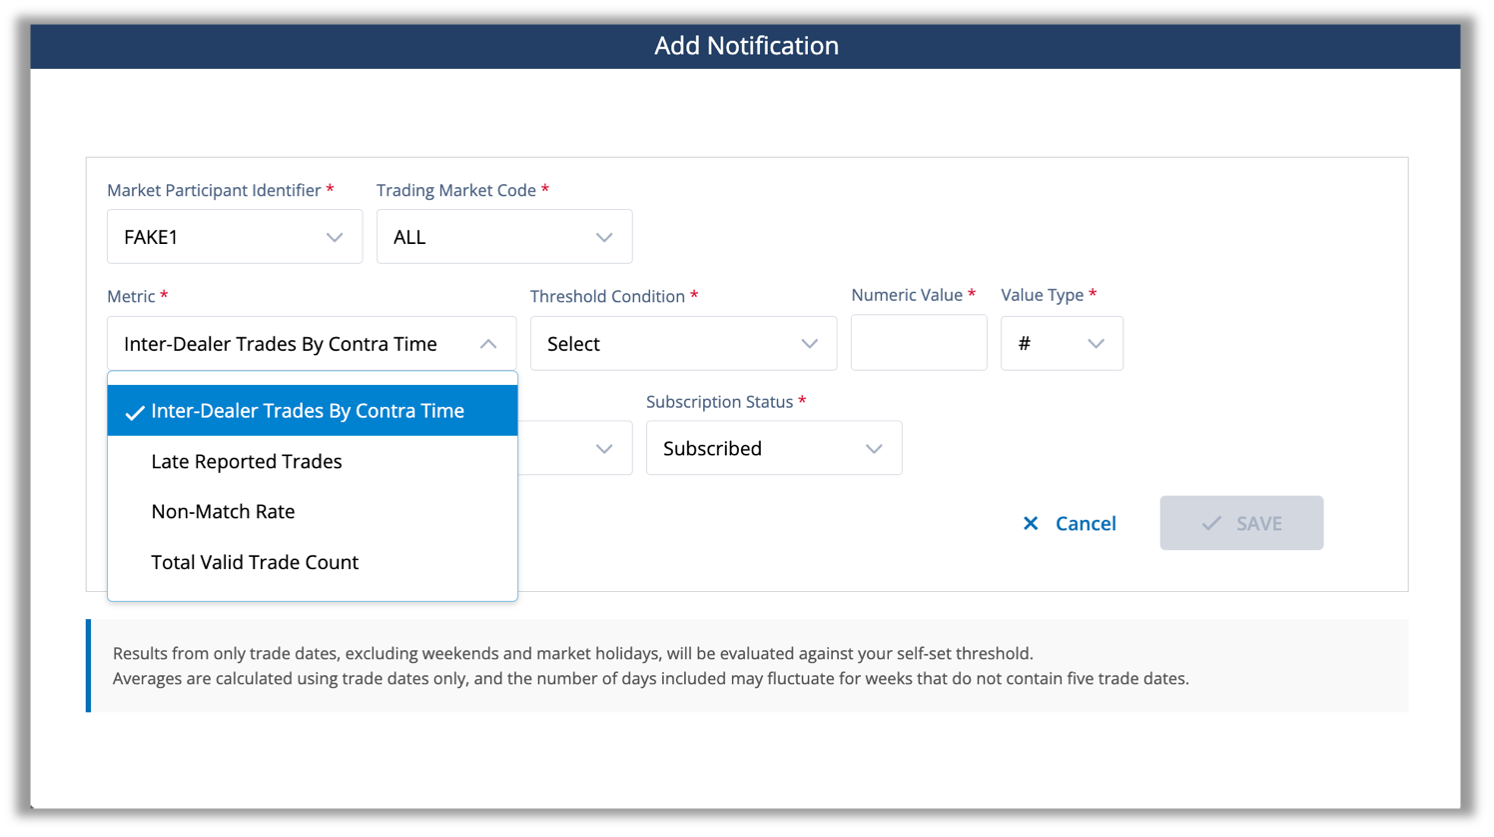
| Metric Name | Metric Definition |
|---|---|
| Inter-Dealer Trades By Contra Time | Inter-dealer trades where the time between a member-reported trade execution time and a contra-party-reported trade execution time exceed a time difference (default 15 minutes) from the perspective of the member. |
| Late Reported Trades | Trades that a member executed but reported greater than the allowable (i.e., Fifteen Minutes) time after the time of execution. |
| Non-Match Rate | Corporate bond trades that a member submitted to TRACE that did not match to a corresponding contra party trade report. |
| Total Valid Trade Count | A trade reported and not cancelled at trade date plus three business days (T+3). This count excludes trades where the member is the contra party on a locked-in trade reported by another member. |
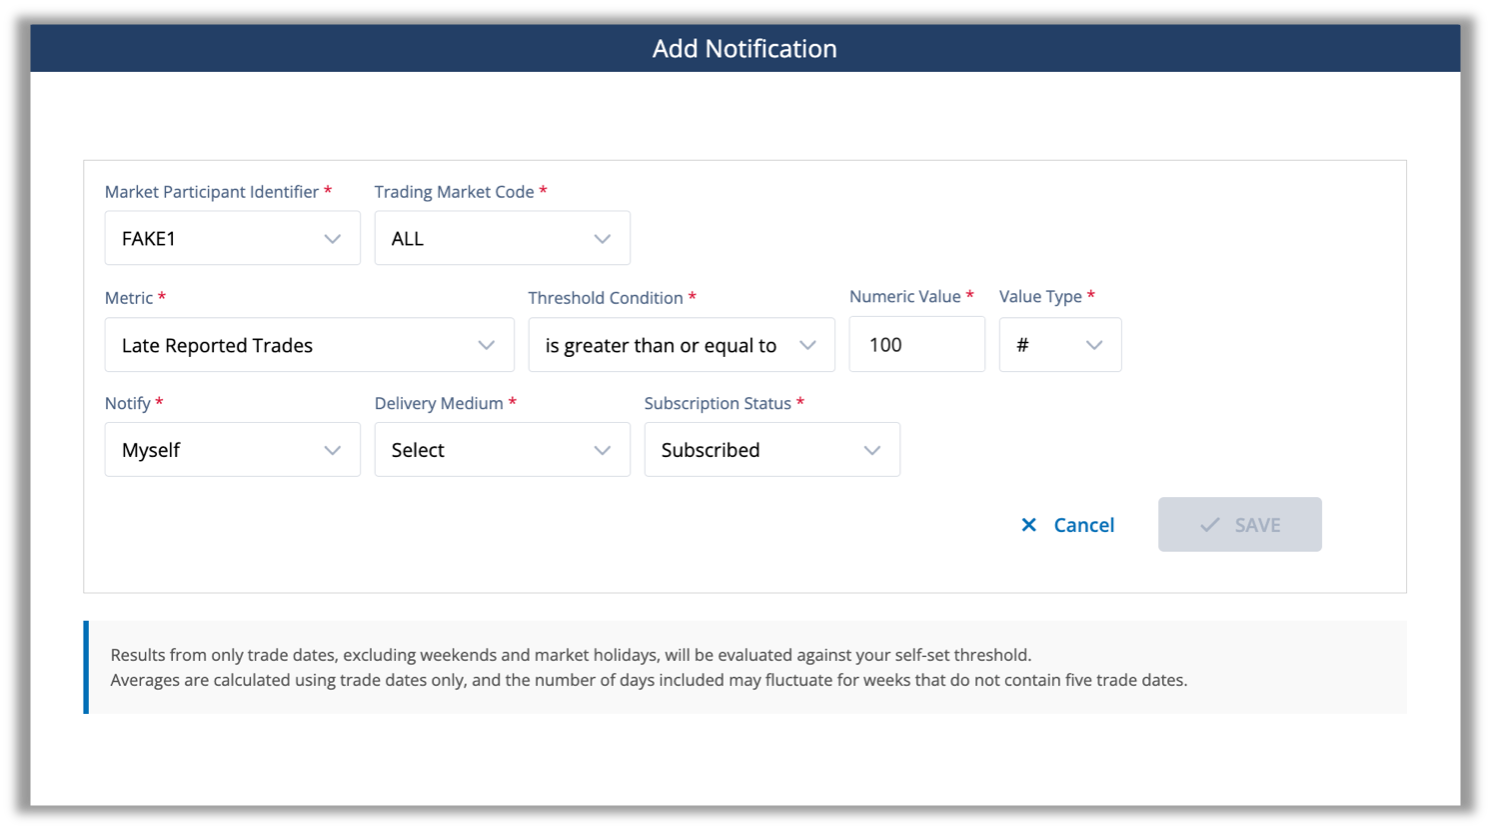
Once you select a Metric, there are three inputs that create a Rule related to that Metric: (1) Threshold Condition (2) Numeric Value; and (3) Value Type.
The first input, Threshold Condition, allows you to select from the following values:
- increased by;
- decreased by;
- is equal to;
- is greater than;
- is greater than or equal to;
- is less than; and
- is less than or equal to.
Following the selection of a Threshold Condition, enter a value in the Numeric Value field and define value as a percentage or numeric in the Value Type input. An example of a Rule could be, for the Late Report Trades Metric, if this Metric is greater than or equal to 100 instances.
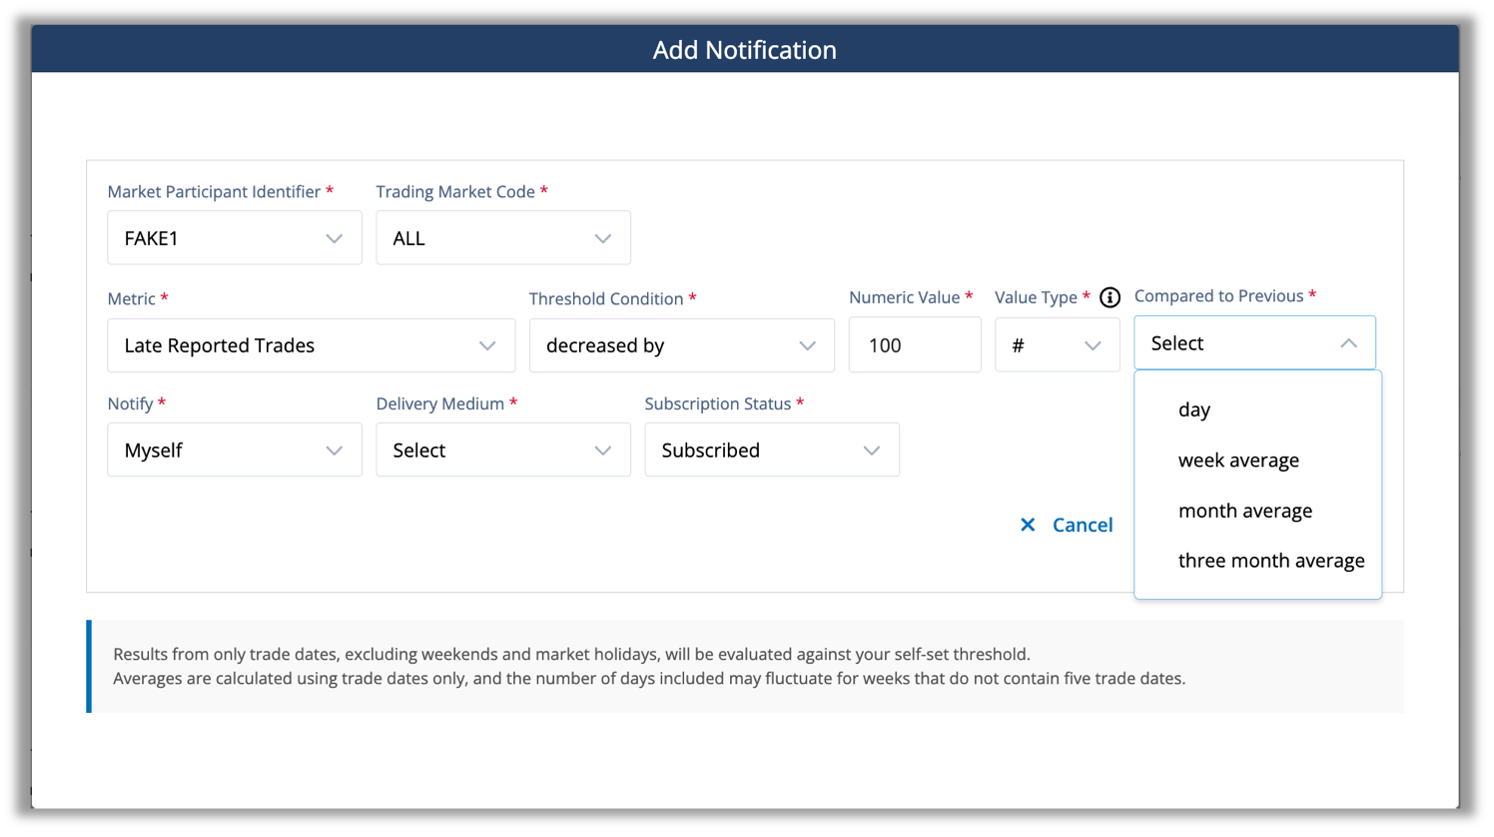
If you select a Threshold Condition of “increased by” or “decreased by”, you can select from the following evaluation periods in the Compared to Previous drop-down.
- day;
- week average;
- month average; and
- three-month average.
Note: Results from only trade dates, excluding weekends and market holidays, will be evaluated against your self-set threshold.
Averages are calculated using trade dates only, and the number of days included may fluctuate for weeks that do not contain five trade dates.
Once you have finalized the notification criteria, you can configure who is notified when a Rule's criteria are met as well as the notification method. Additionally, you can enable or pause notifications using the Subscription Status drop-down. Specifically, the Notify field is auto populated with “myself,” but will include the ability to send to a group email if you have the appropriate permissions (see the next section for more details). The Delivery Medium field allows you to select to be notified via email, via the Gateway notification feature (“Web”), or both; and Subscription Status, which defaults to “subscribed” initially and permits you to “unsubscribe” to previously set Rules – giving you the flexibility to pause a rule without deleting it, and then resubscribe at a later date.
Once a Rule is saved, FINRA will evaluate the relevant Metric against your Threshold on the cadence you have set when the underlying data becomes available. When a relevant threshold is met or exceeded, FINRA will notify you using the Delivery Medium you selected. At any time, you can revisit an existing Rule on the Self-Set Notification page to manage existing Self-Set Notification Rules, create new Rules or unsubscribe from Rules. After you unsubscribe from or delete a Rule, FINRA will no longer evaluate a Metric for the Rule that you had created.
Setting up a Group Notification
Firms may designate certain users to create custom notifications for groups within their organization, including existing distribution lists or group inboxes. These group notifications operate identically to individual user notifications but reach multiple recipients simultaneously.
To set up a group notification, you must have the Interactive Reports Notification Distribution List entitlement. If you are a Super Account Administrator (“SAA”), you can enable this entitlement for yourself or assign it to a member of your firm. If you are not an SAA, please reach out to your SAA to obtain this credential. Once you have the appropriate entitlement, you can create, change, or delete group notifications.
To create a group notification, complete the Rule setting component (i.e., Metric, Threshold Condition, Numeric Value; Value Type) as outlined above and then in the Notify dialog box select “Others.”
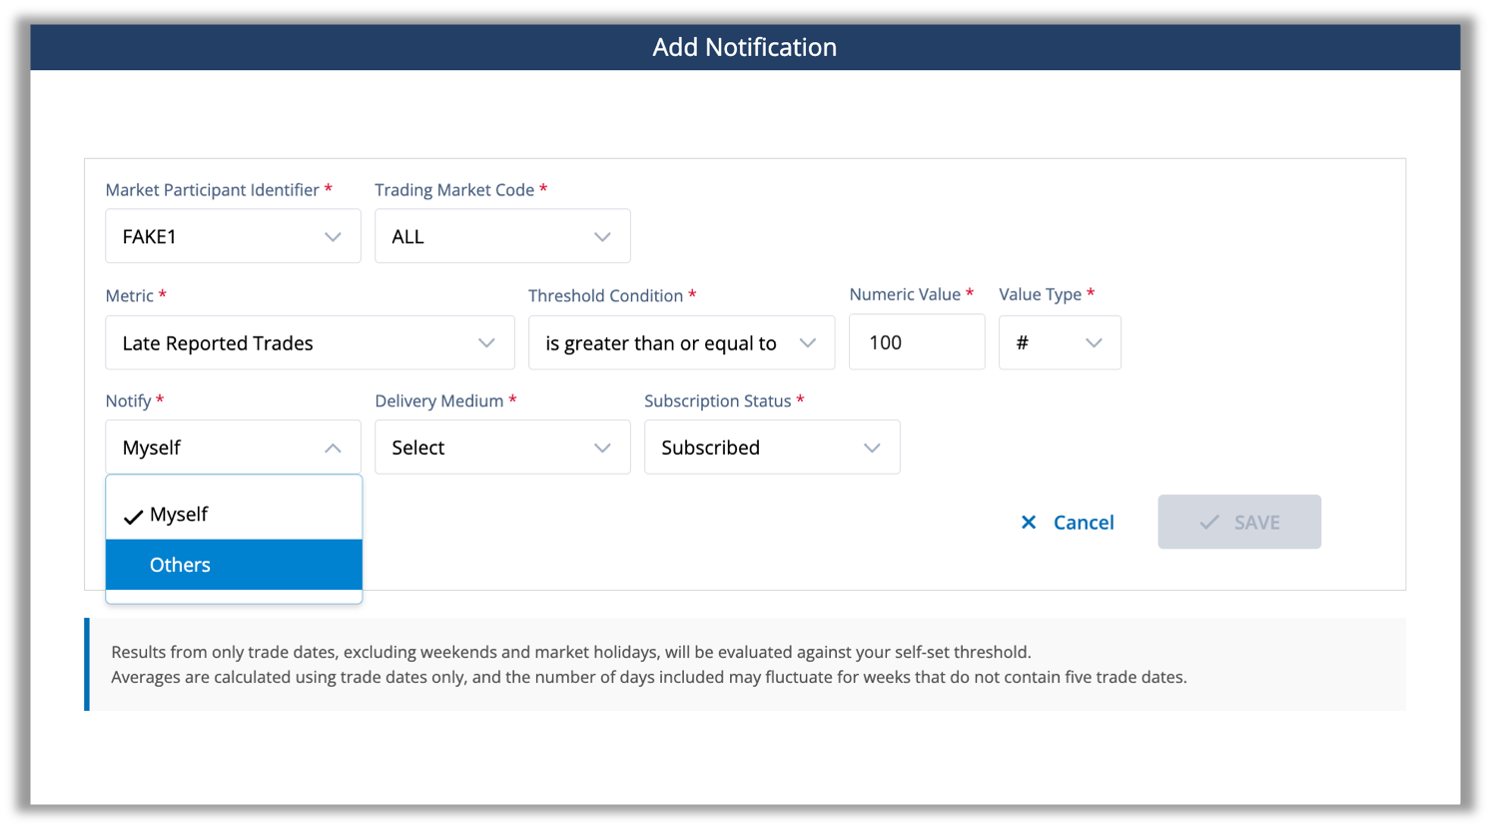
Once you have selected Others, a dialogue box will open called “Distribution Email.” Please enter your desired group email address (e.g., [email protected]) in the Distribution Email free text space. You may enter more than one email address. Once saved, when a relevant threshold is met or exceeded, FINRA will send notifications to this group's email address.
Users with Interactive Reports Notification Distribution List entitlement can edit or unsubscribe from existing group notifications through the Self-Set Notification navigation tab at the top of the interactive report cards user interface.
Self-Set Notification Reference Table
| Attribute Name | Attribute Descriptions |
|---|---|
| Market Participant Identifier | Select one MPID from the drop-down menu |
| Trading Market Code | Select whether the data is for a Primary Market Trade ("P1"), a Secondary Market Trade ("S1"), or both.
|
| Time Exceeds (minutes) |
|
| Metric | Select between:
|
| Threshold Condition |
|
| Numeric Value |
|
| Value Type | For rates, use # for absolute, percentage point changes (e.g., set 10 for a percentage increase from 10% to 20%) and % for relative, percent changes (e.g., set 10% for a percentage increase from 10% to 11%). For counts, use # for absolute changes (e.g., set 10 for an increase from 10 to 20) and % for relative changes (e.g., set 10% for an increase from 10 to 11). |
| Notify |
* The Others option is only available to users who have the Interactive Reports Notification Distribution List entitlement granted by their firm's Super Account Administrator. This option allows designated users, inside a firm, to create or modify custom notifications to be sent to individuals inside their organization, other than themselves, or to shared inbox addresses who would not otherwise have a user account. |
| Delivery Medium |
Web refers to being notified through the Gateway’s notifications, upon logging-in. Email is a notification sent to a designated email address. Web & Email are both methods listed above, at the same time. |
| Subscription Status |
This selection designates if a Custom Notification is currently active or inactive. |
Machine to Machine Daily Data Capabilities
Members can direct FINRA to make a daily TRACE Corporate Bonds data file available for automatic download. This file contains details regarding a member Late Reported, Inter-Dealer and Non-Matched trades for the most recently processed day. FINRA uses a machine-to-machine transfer mechanism called fileX: a centralized, secure file transfer platform where firms can send, track and receive files in one place. Please use the following link to find out more about fileX: https://www.finra.org/filing-reporting/data-transfer-tools/fileX
How to set up fileX access for your TRACE Corporate Bond Daily Interactive Report Card:
Setting up fileX access to TRACE Corporate Bond Daily data is a three-step process.
- Step 1: Request fileX Onboarding: The first step in the fileX onboarding process requires someone at your firm, typically your Super Account Administrator, to contact FINRA Support, and request fileX onboarding. When submitting your request, be sure to specify that you need access for daily data files from the TRACE Corporate Bond Daily Interactive Report Card.
The FINRA Support Center can be contacted using the following:- Email: [email protected]
- Telephone: (800) 321-6273
- Web portal at https://tools.finra.org/cc_support/
- Step 2: Entitlement Configuration: Once your request is submitted, FINRA’s Entitlement Support team will work with your firm to setup File Transfer entitlements, create or update the necessary account, and finally configure File Transfer permissions. Entitlement setup frequently requires a signature from an Authorized Signatory: The Chief Compliance Officer (CCO) or Authorized Officer (or other authorized person) who is currently listed on Schedule A of the organization’s Form BD or the SAA.
The TRACE Corporate Bonds Daily Report Card entitlement details are as follows:Compliance Support General Data. - Step 3: Technical Implementation: After entitlements are configured, your firm's technology team can configure its fileX access using the fileX User Guide, with particular focus on the Entitlement & Access Control section. During this implementation phase, your technical team should review authentication methods and certificates, configure secure connection endpoints, set up automated download schedules, establish file storage and processing workflows, test connectivity and file retrieval, and implement error handling and monitoring to ensure reliable data delivery.
Delivery Timing: New files are made available every day for the most recently processed trading day. However, depending on its activity, your firm may not have data every day. Please note, files are only available for the 30 days following their first availability.
Note: If your firm is considering more than one type of machine-to-machine data access, it is efficient to consolidate your requests into one request, as requesting compliance data sets at different times may require a separate Authorized Signatory signature on a new entitlement request form. As an example, if your firm plans to request machine-to-machine access to CAT AHT Consistency and TRACE Corporate Bond daily data, please consolidate those requests when engaging with FINRA’s Support Center and Entitlement Support team.
If you have questions, please contact the Report Center admin at [email protected].
Manifest
| Attribute Name | Attribute Descriptions |
|---|---|
| Begin Date | Extract begin date. |
| End Date | Extract end date. |
| MPID | Market Participant ID (MPID) of extract. |
| Firm CRD ID | The unique number associated with the broker dealer member in FINRA’s Central Registration Depository (CRD) |
| Trading Market Code | Market associated with the information in the extract: Primary Market ("P1") or Secondary Market ("S1") or both (“All”) |
| Minimum Time Difference | For inter-dealer trades, the minimum time difference in minutes between a contra party executing a trade and a member executing a trade from the perspective of the member. |
| Maximum Time Difference | For inter-dealer trades, the maximum time difference in minutes between a contra party executing a trade and a member executing a trade from the perspective of the member. |
Late Reported Trades
| Attribute Name | Attribute Description |
|---|---|
| Reporting Firm | Market Participant ID (MPID) of the reporting party. |
| Execution Date | Execution date entered in the report side trade entry. |
| Execution Time | Execution time entered in the report side trade entry. |
| Trade Report Date | Reporting date of the report side trade entry. |
| Trade Report Time | Reporting time of the report side trade entry. |
| Execution vs Report Time Difference | Number of seconds difference between the reported execution time and report (trade entry) time. |
| Capacity | Role of the reporting party in the trade. |
| Buy/Sell | Report side of the trade. |
| Bond Symbol | Instrument/security identifier. |
| CUSIP | Instrument/security identifier. |
| Reported Price | Trade price reported. |
| Entered Volume | Trade volume reported. |
| Contra Side MPID | Market Participant ID (MPID) of the contra party. |
| Trading Market | Indicates whether the trade was executed in the primary or secondary market. |
| System Control Date | Reflects the date when TRACE received and processed the report side trade entry. |
| System Control Number | Number assigned by TRACE when the report side trade entry was accepted. |
| Branch Sequence ID | The branch office code sequence number from the reporting party input message, if one was entered. |
Inter-dealer Trades
| Attribute Name | Attribute Description |
|---|---|
| Report Side Executing MPID - Seller | Market Participant ID (MPID) of the reporting party who is on the Sell side of the execution. |
| System Control Date - Seller | Reflects the date when TRACE received and processed the Sell side trade entry. |
| System Control Number - Seller | Number assigned by TRACE when the Sell side trade entry was accepted. |
| Execution Date - Seller | Execution date entered in the Sell side trade entry. |
| Execution Time - Seller | Execution time entered in the Sell side trade entry. |
| Report Date - Seller | Reporting date of the Sell side trade entry. |
| Report Time - Seller | Reporting time of the Sell side trade entry. |
| Entered Price - Seller | Trade price of the Sell side trade entry. |
| Entered Volume - Seller | Trade volume of the Sell side trade entry. |
| Bond Symbol | Instrument/security identifier. |
| CUSIP | Instrument/security identifier. |
| Execution Time Difference vs Contra Firm | Number of seconds difference between the execution time reported by the Reporting MPID and the execution time reported by the Contra MPID. |
| Report Side Executing MPID - Buyer | Market Participant ID (MPID) of the reporting party who is on the Buy side of the execution. |
| System Control Date - Buyer | Reflects the date when TRACE received and processed the Buy side trade entry. |
| System Control Number - Buyer | Number assigned by TRACE when the Buy side trade entry was accepted. |
| Execution Date - Buyer | Execution date entered in the Buy side trade entry. |
| Execution Time - Buyer | Execution time entered in the Buy side trade entry. |
| Report Date - Buyer | Reporting date of the Buy side trade entry. |
| Report Time - Buyer | Reporting time of the Buy side trade entry. |
| Entered Price - Buyer | Trade price of the Buy side trade entry. |
| Entered Volume - Buyer | Trade volume of the Buy side trade entry. |
| Trading Market | Indicates whether the trade was executed in the primary or secondary market. |
| Branch Sequence ID | The branch office code sequence number from the reporting party input message, if one was entered. |
Non-Matched Trades
| Attribute Name | Attribute Description |
|---|---|
| Reporting Firm | Market Participant ID (MPID) of the reporting party. |
| Trade Execution Date | Execution date entered in the report side trade entry. |
| Trade Execution Time | Execution time entered in the report side trade entry. |
| Trade Report Date | Reporting date of the report side trade entry. |
| Trade Report Time | Reporting time of the report side trade entry. |
| Reporting Capacity Code | Role of the reporting party in the trade. |
| Report Side Code | Report side of the trade. |
| Bond Symbol | Instrument/security identifier. |
| CUSIP | Instrument/security identifier. |
| Reported Price | Trade price reported. |
| Entered Volume Quantity | Trade volume reported. |
| Contra Side Market Participant ID | Market Participant ID (MPID) of the contra party. |
| Trading Market Code | Indicates whether the trade was executed in the primary or secondary market. |
| System Control Date | Reflects the date when TRACE received and processed the report side trade entry. |
| System Control Number | Number assigned by TRACE when the report side trade entry was accepted. |
| Branch Sequence ID | The branch office code sequence number from the reporting party input message, if one was entered. |