Market Data
FINRA collects certain market data as part of its role in overseeing trading and providing transparency services. Following are select tables drawn from that data.
Table of Contents
- Table 3.1 National Market Systems (NMS) Stocks Trading Summary, 2017–2021
- Table 3.2 National Market Systems (NMS) Stocks Trading by Venue Type, 2018–2021
- Figure 3.1 Monthly National Market Systems (NMS) Stocks Trading by Venue Type (January 2, 2021 − December 31, 2021)
- Figure 3.2 Monthly National Market Systems (NMS) Stocks Trading During Non-Exchange Hours (January 2, 2021 − December 31, 2021)
- Table 3.3 National Market Systems (NMS) Stocks Trading by Product Type, 2021
- Table 3.4 Order Audit Trail System (OATS) Activity – Total OATS Events, 2016–2020
- Table 3.5 Order Audit Trail System (OATS) Activity – Daily Average OATS Events, 2016–2020
- Table 3.6 Over-the-Counter (OTC) Equities Market Statistics, 2017–2021
- Figure 3.3 Monthly OTC Equities Trading by Venue Type (January 2, 2021 − December 31, 2021)
- Table 3.7 TRACE Reported Fixed Income Activity by Product Type and Venue Type, 2018–2021
- Figure 3.4 Monthly TRACE Reported Fixed Income Activity By Product Type and Venue Type (January 2, 2021 − December 31, 2021)
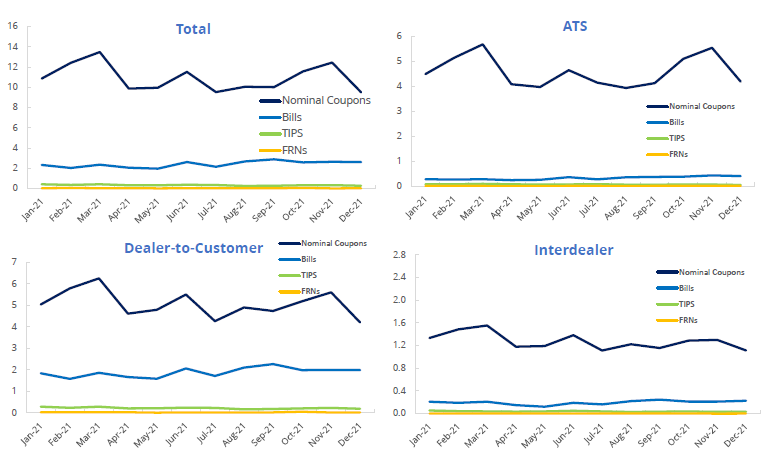
- Figure 3.5 Monthly U.S. Treasuries Dollar Volumes by Participant and Product Type (January 2, 2021 − December 31, 2021)
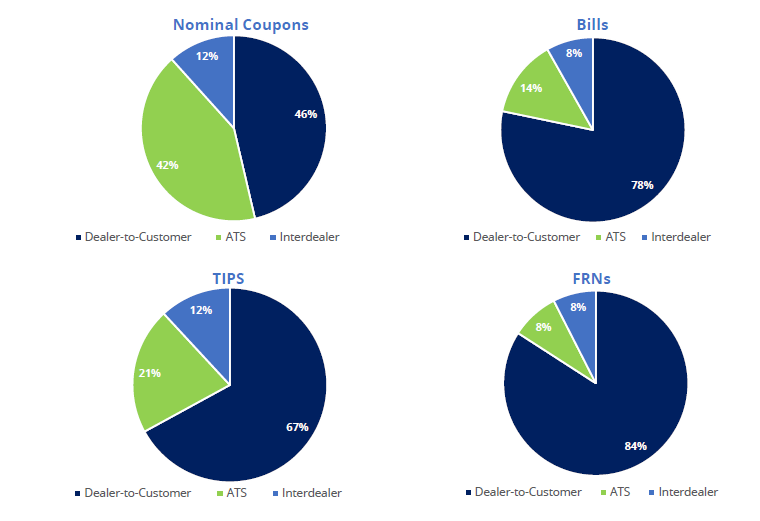
- Figure 3.6 U.S. Treasuries Dollar Volumes by Product Type and Participant, 2021
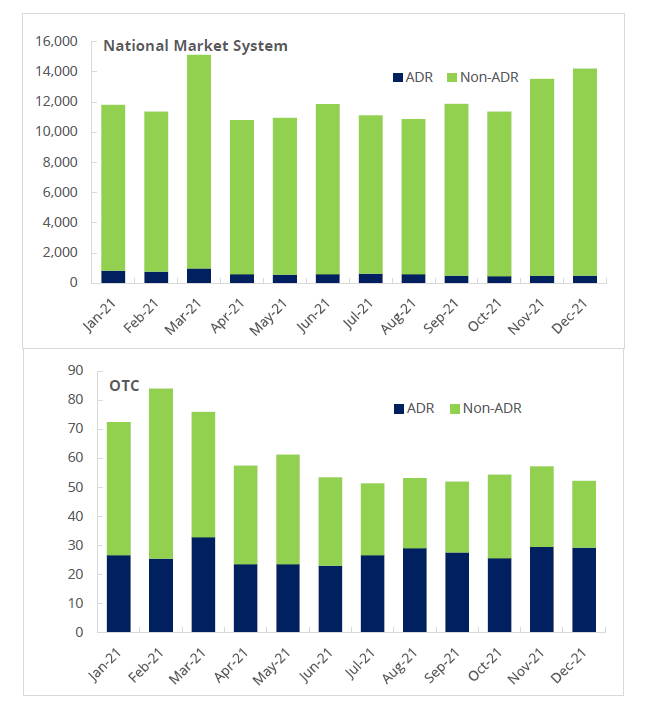
- Figure 3.7 Monthly American Depository Receipt (ADR) Trading by Venue
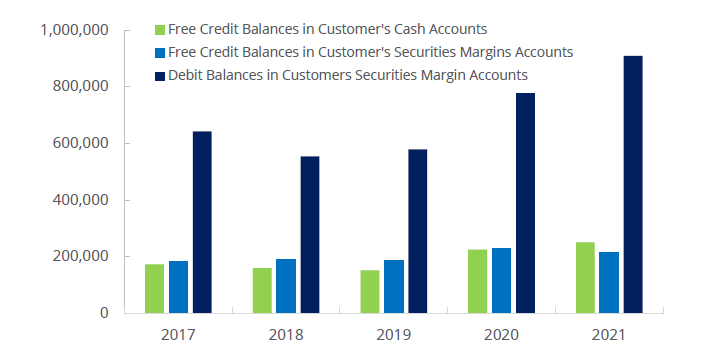
- Figure 3.8 FINRA-Registered Firms - Customer Margin Balances, 2017-2021
Table 3.1 National Market Systems (NMS) Stocks Trading Summary, 2017–2021
| Year | Total Consolidated Volume | Total OTC1 | Percent OTC |
| 2017 | 1,642,696,484,455 | 616,183,840,401 | 37.5 |
| 2018 | 1,841,855,556,392 | 668,455,710,212 | 36.3 |
| 2019 | 1,771,096,807,512 | 659,344,146,179 | 37.2 |
| 2020 | 2,773,109,114,496 | 1,150,323,435,489 | 41.5 |
| 2021 | 2,874,893,079,386 | 1,255,101,462,172 | 43.7 |
Source: UTP Trade Data Feed and Consolidated Tape System. Data as of February 2022.
1OTC includes all FINRA facilities (the FINRA/Nasdaq TRF, the FINRA/NYSE TRF and the FINRA Alternative Display Facility).
Table 3.2 National Market Systems (NMS) Stocks Trading by Venue Type, 2018–2021
| 2018 | 2019 | 2020 | 2021 | ||
| Avg. Daily Transactions |
|||||
| Exchange | 28,495,951 | 28,318,018 | 43,086,738 | 51,276,383 | |
| Alternative Trading Systems | 4,467,009 | 4,421,323 | 6,283,268 | 7,791,035 | |
| Non-Alternative Trading Systems OTC | 3,647,186 | 3,638,728 | 9,282,650 | 13,141,709 | |
| Total | 36,610,146 | 36,378,069 | 58,652,656 | 58,975,000 | |
| Avg. Daily Volume (in $ billions) |
|||||
| Exchange | 235.4 | 209.1 | 296.3 | 368.0 | |
| Alternative Trading Systems | 43.9 | 39.8 | 54.4 | 65.6 | |
| Non-Alternative Trading Systems OTC | 79.3 | 74.3 | 130.4 | 153.9 | |
| Total | 358.7 | 323.2 | 481.0 | 587.5 | |
Source: Financial Industry Regulatory Authority. Data as of February 2022.
Figure 3.1 Monthly National Market Systems (NMS) Stocks Trading by Venue Type1
(January 2, 2021 − December 31, 2021)
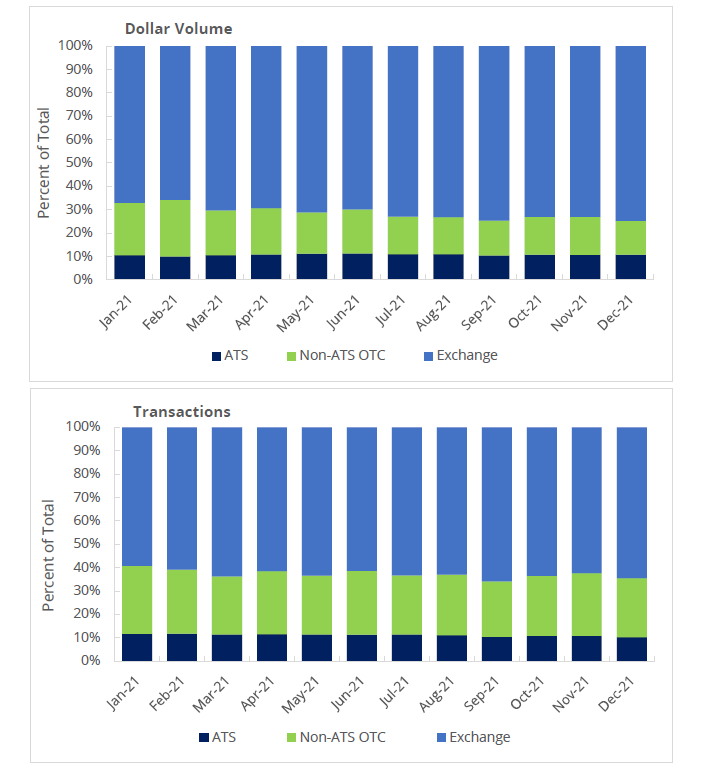
Source: Financial Industry Regulatory Authority. Data as of February 2022.
1ATS stands for Alternative Trading Systems
Figure 3.2 Monthly National Market Systems (NMS) Stocks Trading During Non-Exchange Hours
(January 2, 2021 − December 31, 2021)
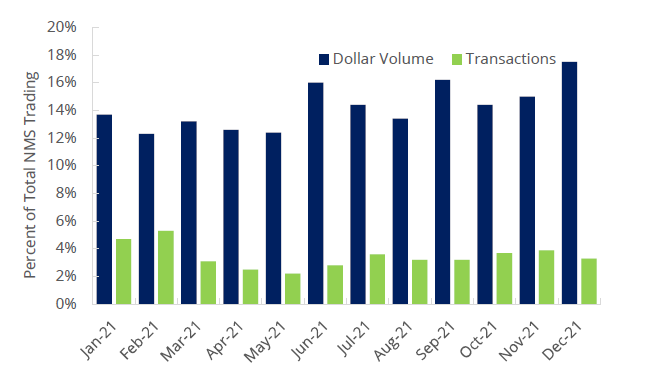
Source: Financial Industry Regulatory Authority. Data as of February 2022.
Table 3.3 National Market Systems (NMS) Stocks Trading by Product Type, 2021
| Dollar Volumes by Subtype (in $ billions) | ||||
|---|---|---|---|---|
| Month | ADR1 | Common Stock | ETP2 | Other |
| January | 475 | 4,805 | 522 | 1,246 |
| February | 472 | 4,722 | 563 | 1,215 |
| March | 617 | 6,149 | 1,096 | 1,826 |
| April | 374 | 4,489 | 619 | 1,198 |
| May | 368 | 4,554 | 730 | 1,338 |
| June | 380 | 5,115 | 530 | 1,291 |
| July | 642 | 7,342 | 987 | 2,142 |
| August | 602 | 7,437 | 878 | 1,949 |
| September | 516 | 7,918 | 1,209 | 2,236 |
| October | 478 | 7,680 | 1,066 | 2,142 |
| Novermber | 507 | 9,546 | 1,064 | 2,411 |
| December | 507 | 9,270 | 1,495 | 2,943 |
Source: Financial Industry Regulatory Authority. Data as of February 2022.
1ADR stands for American Depository Receipts.
2ETP stands for Exchange Traded Products, and includes Exchange Traded Funds, Exchange Traded Notes, and Exchange Traded Debt.
Table 3.4 Order Audit Trail System (OATS) Activity – Total OATS Events, 2016–20201
| Year | OATS Messages2 | Trade Executions | Number of Shares | Value of Executions ($) |
| 2016 | 727,812,241,098 | 3,961,320,427 | 3,656,985,412,829 | $42,781,770,202,084 |
| 2017 | 531,866,067,552 | 3,527,221,666 | 6,525,698,297,889 | $42,078,647,880,622 |
| 2018 | 729,720,486,018 | 3,973,693,014 | 5,725,806,866,105 | $52,733,733,403,793 |
| 2019 | 709,261,663,217 | 3,981,521,453 | 4,418,448,611,423 | $50,295,154,729,577 |
| 2020 | 1,165,005,274,005 | 7,742,534,063 | 8,543,001,368,752 | $79,121,035,610,193 |
Source: Financial Industry Regulatory Authority. Data as of March 2021. Since OATS is no longer operating, this table will be deprecated.
1OATS events are aggregated using the event date.
2OATS messages include orders, order cancellations, order modifications, new order routes and trade executions.
Table 3.5 Order Audit Trail System (OATS) Activity – Daily Average OATS Events, 2016–20201
| Year | Number of Business Days |
OATS Messages2 | Trade Executions | Number of Sales | Value of Executions ($) |
| 2016 | 252 | 2,888,153,572 | 15,700,538 | 14,288,571,416 | $229,150,816,535 |
| 2017 | 251 | 2,116,668,839 | 14,049,409 | 25,994,025,949 | $167,638,810,372 |
| 2018 | 251 | 2,906,930,789 | 15,833,795 | 22,810,045,740 | $210,082,567,583 |
| 2019 | 252 | 2,814,333,738 | 15,751,589 | 17,803,201,168 | $197,800,786,367 |
| 2020 | 253 | 4,604,124,690 | 30,602,130 | 33,766,539,722 | $312,712,074,022 |
Source: Financial Industry Regulatory Authority. Data as of March 2021. Since OATS is no longer operating, this table will be deprecated.
1OATS events are aggregated using the event date.
2OATS messages include orders, order cancellations, order modifications, new order routes and trade executions.
Table 3.6 Over-the-Counter (OTC) Equities Market Statistics, 2017–20211
| Year | Average Daily OTC Equities Share Volume |
Average Daily OTC Equities Dollar Volume ($) |
Average Daily OTC Equities Transactions |
| 2017 | 11,107,884,572 | $1,141,485,511 | 162,649 |
| 2018 | 8,588,230,489 | $1,511,608,769 | 209,102 |
| 2019 | 6,027,132,766 | $1,327,157,208 | 180,381 |
| 2020 | 11,559,398,293 | $1,793,254,116 | 319,598 |
| 2021 | 39,554,616,558 | $2,878,628,236 | 623,571 |
Source: FINRA OTCE Market Statistics. Data as of February 2022.
1Differences in historical series reflect changes in underlying data over time.
Figure 3.3 Monthly OTC Equities Trading by Venue Type
(January 2, 2021 − December 31, 2021)
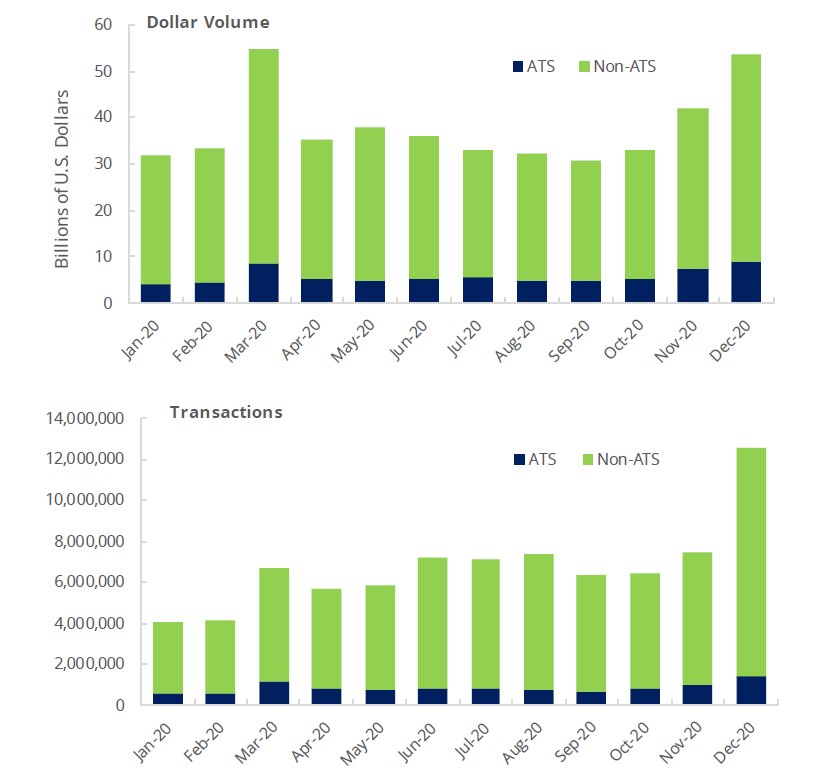
Source: Financial Industry Regulatory Authority. Data as of February 2022.
Table 3.7 TRACE Reported Fixed Income Activity by Product Type and Venue Type, 2018–20211
| Corporate and Agency | 2018 | 2019 | 2020 | 2021 | |
| Avg. Daily Transactions |
|||||
| Alternative Trading Systems | 13,494 | 13,884 | 12,427 | 11,724 | |
| OTC | 51,388 | 55,338 | 57,556 | 55,590 | |
| Total | 64,882 | 69,222 | 69,983 | 67,315 | |
| Avg. Daily Volume (in $ billions) |
|||||
| Alternative Trading Systems | 1.7 | 2.1 | 2.9 | 3.6 | |
| OTC | 34.7 | 37.7 | 43.4 | 38.8 | |
| Total | 36.3 | 39.8 | 46.4 | 42.4 | |
| Securitized Products | 2018 | 2019 | 2020 | 2021 | |
| Avg. Daily Transactions |
|||||
| Alternative Trading Systems | 3,525 | 4,744 | 3,960 | 3,267 | |
| OTC | 9,403 | 9,513 | 9,785 | 10,175 | |
| Total | 12,928 | 14,256 | 13,745 | 13,443 | |
| Avg. Daily Volume (in $ billions) |
|||||
| Alternative Trading Systems | 46.4 | 69.0 | 67.9 | 60.7 | |
| OTC | 192.9 | 198.9 | 247.0 | 240.9 | |
| Total | 239.3 | 267.9 | 314.9 | 301.5 | |
Source: Financial Industry Regulatory Authority. Data as of February 2022.
1The Trade Reporting and Compliance Engine (TRACE) facilitates the mandatory reporting of over-the-counter secondary market transactions in eligible fixed income securities. Differences in historical series reflect changes in underlying data.
Figure 3.4 TRACE Reported Fixed Income Monthly Summary Activity By Product Type and Venue Type1
(January 2, 2021 − December 31, 2021)
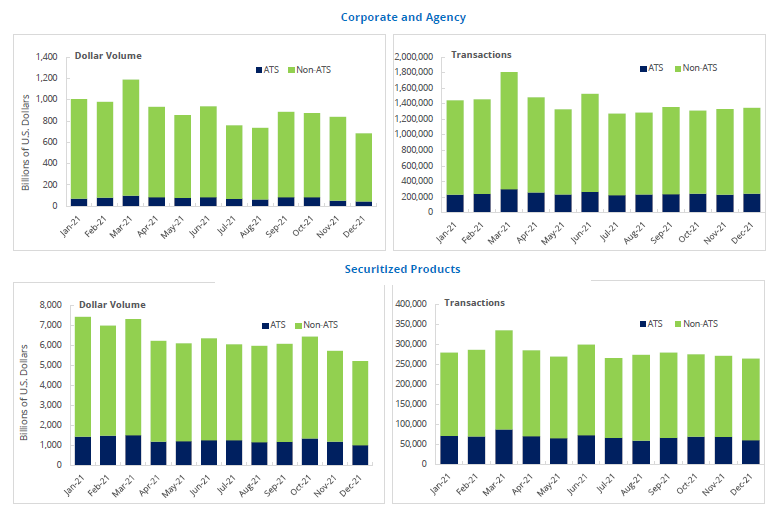
Source: Financial Industry Regulatory Authority. Data as of February 2022.
1The Trade Reporting and Compliance Engine (TRACE) facilitates the mandatory reporting of over-the-counter secondary market transactions in eligible fixed income securities.
Figure 3.5 Monthly U.S. Treasuries Dollar Volumes by Participant and Product Type, 20201,2
(January 2, 2021 − December 31, 2021; In trillions of USD)
Source: Financial Industry Regulatory Authority. Data as of February 2022.
1The "ATS and Interdealer" category includes the sell side of a trade data when (1) a trade is executed on an ATS (including ATS sales to non-members or non-member affiliates) or (2) a trade is executed between FINRA members outside of an ATS (i.e. dealer-to-dealer trades). The category excludes a FINRA member sell to an ATS. This approach takes into account multiple reporting of trades where a trade involves an ATS or both sides are FINRA members.
2The "Dealer-to-Customer" category includes all trades (buys and sells) reported by a FINRA member against non-members or non-member affiliates. The category excludes ATS transactions with non-members and non-member affiliates (those trades are represented in the "ATS and Interdealer" category as noted above).
Figure 3.6 U.S. Treasuries Dollar Volumes by Product Type and Participant, 20211,2
(In percent of product type)
Source: Financial Industry Regulatory Authority. Data as of February 2022.
1The "ATS and Interdealer" category includes the sell side of a trade data when (1) a trade is executed on an ATS (including ATS sales to non-members or non-member affiliates) or (2) a trade is executed between FINRA members outside of an ATS (i.e. dealer-to-dealer trades). The category excludes a FINRA member sell to an ATS. This approach takes into account multiple reporting of trades where a trade involves an ATS or both sides are FINRA members.
2The "Dealer-to-Customer" category includes all trades (buys and sells) reported by a FINRA member against non-members or non-member affiliates. The category excludes ATS transactions with non-members and non-member affiliates (those trades are represented in the "ATS and Interdealer" category as noted above).
Figure 3.7 Monthly American Depository Receipt (ADR) Trading by Venue
(January 1, 2021 - December 31, 2021; In billins of USD)
Source: Financial Industry Regulatory Authority. Data as of February 2022.
Figure 3.8 FINRA-Registered Firms – Customer Margin Balances, 2017−20211,2
(millions of U.S. dollars at year end)
Source: Customer Balance Summary Forms.
1Pursuant to FINRA Rule 4521(d), FINRA member firms carrying margin accounts for customers are required to submit, on a settlement date basis, as of the last business day of the month, the following customer information: (i) the total of all debit balances in securities margin accounts; and (ii) the total of all free credit balances in all cash accounts and all securities margin accounts.
2Debit Balances are derived by adding NYSE Debit Balances in Margin Accounts to FINRA Debit Balances in Customers' Cash and Margin Accounts. Credit Balances are derived by adding NYSE Free Credit Balances in Cash and Margin Accounts to FINRA Free and Other Credit Balances in Customers' Securities Accounts..