Special Topics
Figure 4.1 SPAC Filings by Year and Size, 2017-20211
(in millions of USD)
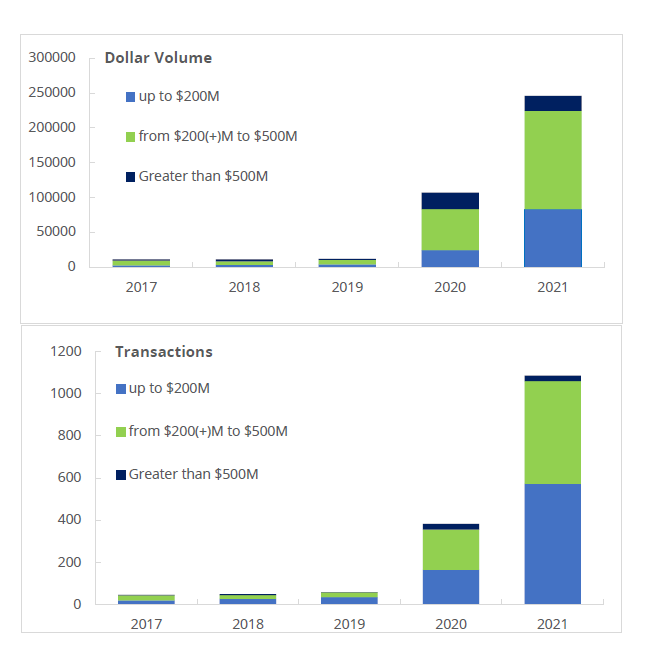
Source: FINRA Public Offering Filing System. Data as of February 2022.
11Special purpose acquisition companies (SPACs) are shell companies that raise capital in initial public offerings (IPOs) for the purpose of merging with or acquiring an operating company.
Figure 4.2 Average and Median Size of SPAC Filings, 2017-2021
(in millions of USD)
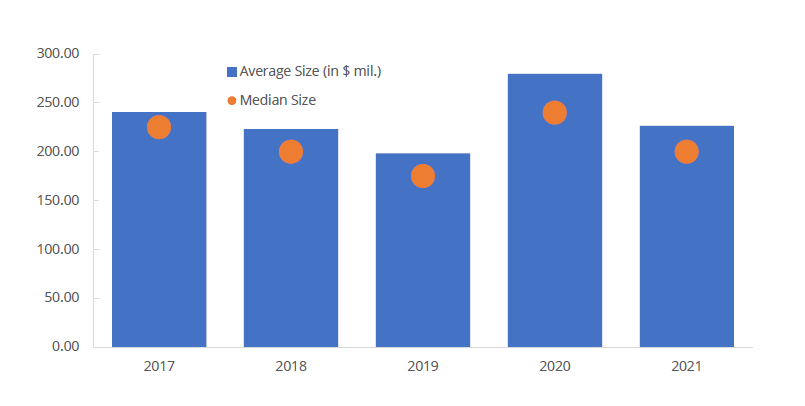
Source: FINRA Public Offering Filing System. Data as of February 2022.
Table 4.1 Consolidated Audit Trail (CAT) Order reporting - Total CAT Equity Events
(January 1, 2021 - December 31, 2021; in Millions)
| Exchange | Industry Member | |||||||||
| Month | Executions | Cancellations | New Orders | Modifies | Routes | Executions | Cancellations | New Orders | Modifies | Routes |
| January | 2,181 | 56,825 | 57,969 | 33,319 | 181 | 103,482 | 1,717 | 7,920 | 107,698 | 126,019 |
| February | 2,257 | 60,089 | 61,289 | 35,177 | 172 | 110,739 | 1,849 | 8,689 | 113,907 | 132,950 |
| March | 2,824 | 87,962 | 89,425 | 53,587 | 240 | 162,424 | 1,759 | 12,946 | 163,970 | 190,489 |
| April | 1,943 | 59,758 | 60,783 | 35,451 | 147 | 107,958 | 1,256 | 6,891 | 109,421 | 127,458 |
| May | 2,079 | 69,204 | 70,280 | 42,298 | 135 | 126,657 | 1,263 | 8,712 | 126,025 | 146,986 |
| June | 2,256 | 67,455 | 63,663 | 25,888 | 2,485 | 112,724 | 1,464 | 6,760 | 113,734 | 133,142 |
| July | 1,991 | 66,986 | 64,007 | 26,625 | 2,080 | 114,790 | 1,195 | 7,822 | 115,624 | 134,694 |
| August | 2,021 | 66,945 | 64,178 | 27,150 | 1,984 | 110,573 | 1,163 | 7,523 | 113,981 | 132,235 |
| September | 2,180 | 75,344 | 72,370 | 31,818 | 2,123 | 130,622 | 1,169 | 9,427 | 130,375 | 151,911 |
| October | 2,036 | 69,039 | 66,154 | 28,950 | 2,012 | 119,484 | 1,175 | 8,882 | 120,009 | 139,222 |
| November | 2,367 | 67,389 | 64,660 | 26,942 | 2,078 | 118,483 | 1,385 | 9,674 | 121,009 | 140,697 |
| December | 2,485 | 81,437 | 78,567 | 34,166 | 2,145 | 151,552 | 1,285 | 13,908 | 143,827 | 173,981 |
Source: Financial Industry Regulatory Authority. Data as of February 2022.
Table 4.2 Consolidated Audit Trail (CAT) Order reporting - Daily Average CAT Equity Events
(January 1, 2021 - December 31, 2021; in Millions)
| Exchange | Industry Member | ||||||||||
| Month | Number of Business Days | Executions | Cancellations | New Orders | Modifies | Routes | Executions | Cancellations | New Orders | Modifies | Routes |
| January | 19 | 115 | 2,991 | 3,051 | 1,754 | 10 | 5,446 | 90 | 417 | 5,668 | 6,633 |
| February | 19 | 119 | 3,163 | 3,226 | 1,851 | 9 | 5,828 | 97 | 457 | 5,995 | 6,997 |
| March | 23 | 123 | 3,824 | 3,888 | 2,330 | 10 | 7,062 | 76 | 563 | 7,129 | 8,282 |
| April | 21 | 93 | 2,846 | 2,894 | 1,688 | 7 | 5,141 | 60 | 328 | 5,211 | 6,069 |
| May | 20 | 104 | 3,460 | 3,514 | 2,115 | 7 | 6,333 | 63 | 436 | 6,301 | 7,349 |
| June | 22 | 103 | 3,066 | 2,894 | 1,777 | 113 | 5,124 | 67 | 307 | 5,170 | 6,052 |
| July | 21 | 95 | 3,190 | 3,048 | 1,268 | 99 | 5,446 | 57 | 372 | 5,506 | 6,414 |
| August | 22 | 92 | 3,043 | 2,917 | 1,234 | 90 | 5,026 | 53 | 342 | 5,181 | 6,011 |
| September | 21 | 104 | 3,588 | 3,446 | 1,515 | 101 | 6,220 | 56 | 449 | 6,208 | 7,234 |
| October | 21 | 97 | 3,288 | 3,150 | 1,379 | 96 | 5,690 | 56 | 423 | 5,715 | 6,630 |
| November | 21 | 113 | 3,209 | 3,079 | 1,283 | 99 | 5,642 | 66 | 461 | 5,762 | 6,700 |
| December | 22 | 113 | 3,702 | 3,571 | 1,553 | 97 | 6,889 | 58 | 632 | 6,538 | 7,908 |
Source: Financial Industry Regulatory Authority. Data as of February 2022.
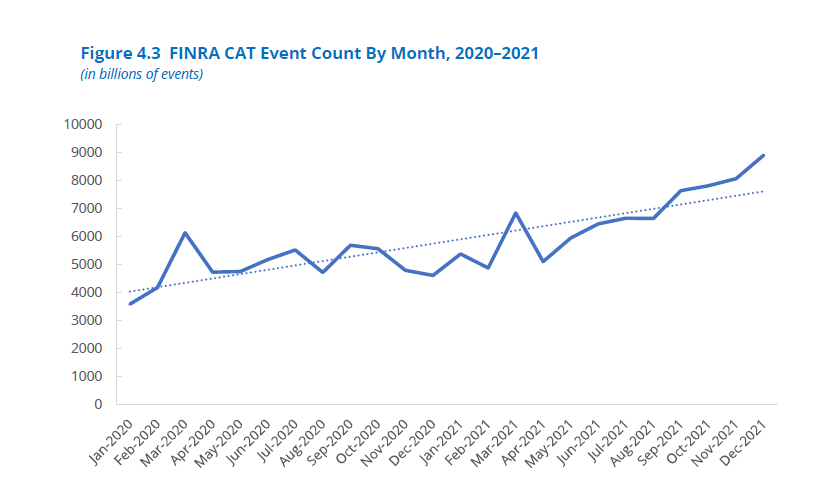
Figure 4.3 FINRA CAT Event Count By Month, 2020-2021
(in billions of events)