
MSRB Markup/Markdown Indicators
Overview
To facilitate price discovery and enable regulatory oversight, the Municipal Securities Rulemaking Board’s (MSRB’s) Real-time Transaction Reporting System (RTRS) collects, processes, and disseminates transaction data for municipal securities. MSRB Rule G-30 requires that member firms buy from/sell to customers at prices that are fair and that mark-ups, mark-downs, and commissions charged by member firms must be reasonable.
The MSRB Mark-Up/Mark-Down Interactive Indicators Dashboard (MU/MD Indicators Dashboard) is a voluntary tool to assist firms in the supervision of customer trade pricing by providing transparency into a portion of FINRA’s surveillance program for municipal pricing activity.
“Indicators” are designed to share trends and analytic observations with firms in different risk areas that may help inform more general assessments of rule compliance when paired with additional information about facts and circumstances. Like report cards, these indicators also provide firms with comparative analysis to let them know how their activity looks relative to peers and the industry.
The classic MSRB Mark-Up/Mark-Down Analysis Report provides members with a monthly report with industry pricing statistics and underlying detail built upon logic that pairs purchase and sale transactions reported to RTRS by member firms. These pairs can be single-trade events (involving one purchase and one sale trade report) or multi-trade events (multiple transactions associated with the purchase or sale; e.g., the member firm may obtain a large block of bonds that are sold to multiple customers) within the same trading day. Since not every customer transaction will result in FINRA’s logic creating a pair, unpaired transactions are excluded from this report.
FINRA analyzes all RTRS reported transactions in municipal securities to create the following pairs:
- Mark-Up Pairs - A member firm purchases a security from another member firm and then sells the same security to a customer.
- Mark-Down Pairs - A member firm purchases a security from a customer and then sells the same security to another member firm.
- Customer-to-Customer Pairs - A member firm purchases a security from a customer and then sells the same security to another customer.
The analysis does not take into account a number of factors that may influence the calculation of the Mark-Up, Mark-Down, or Customer-to-Customer prices (e.g., market movements, affiliated relationships, or variety of services offered). Further, the information provided does not reflect FINRA’s judgment that the pricing of a specific transaction(s) violates MSRB Rule G-30.
The MU/MD Indicators Dashboard provides similar insights to the monthly report but on a daily cadence and with an interactive, dynamic interface. On a delayed daily (Trade Date Plus Six Days (T+6)) basis, firms can review Mark-Up/Mark-Down activity for a defined period (either month by month or a specified date range), identify instances that may require additional analysis, and compare activity against industry benchmarks. In contrast to the classic monthly reports, the MU/MD Indicators Dashboard also enables users to define the time frame of activity under review, leverage visualization tools, such as Dollar and/or Percent Thresholds, configure notifications for activity that exceeds self-set parameters, and view/export specific trade details of the activity (underlying security, prices, counterparties, etc.) within the dashboard.
On This Page
- How it Works
- Export to CSV
- Self-Set Notifications
- Export File Layouts
- Trade Visualizations Underlying Details
How it Works
Each business day, on a delayed (T+6) basis, the MU/MD Indicators Dashboard ingests RTRS trade data and pairs available trades in the Mark-Up, Mark-Down, and Customer-to-Customer categories. The MU/MD Indicators Dashboard then calculates the percentage profit for each trade pair and makes the detail regarding these pairs available through the Trade Visualizations and Trade Details dashboard tabs outlined below. This data is also available via an export to CSV function.
Each month, the MU/MD Indicators Dashboard aggregates the daily output of all industry participants and creates detailed firm-specific and industry statistics regarding Mark-Up, Mark-Down, and Customer-to-Customer activity.
Features and Tools
As outlined in detail below, this MU/MD Indicators Dashboard has the following functionality:
- Market Participant Identifier (MPID)
- Industry Benchmark
- Trade Visualizations
- Trade Details
- Export to CSV
- Self-Set Notifications
- Export File Layouts
Market Participant Identifier (MPID)
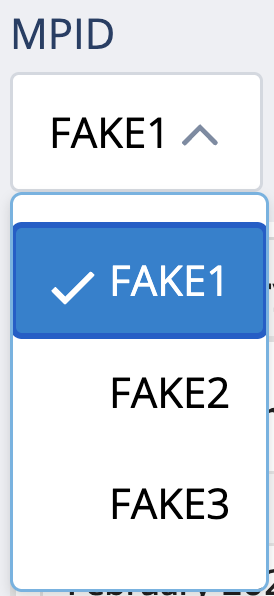
On the top left of the MU/MD Indicators Dashboard, the MPID drop-down selector field, MPID, displays the MPID(s) available to the member accessing the MU/MD Indicators Dashboard. If a member has access to multiple MPIDs associated with the member firm, the MPID drop-down selector will permit the member to select a different MPID. This selection drives the data available in the Industry Benchmark, Trade Visualizations, and Trade Detail tabs discussed below.
Industry Benchmark
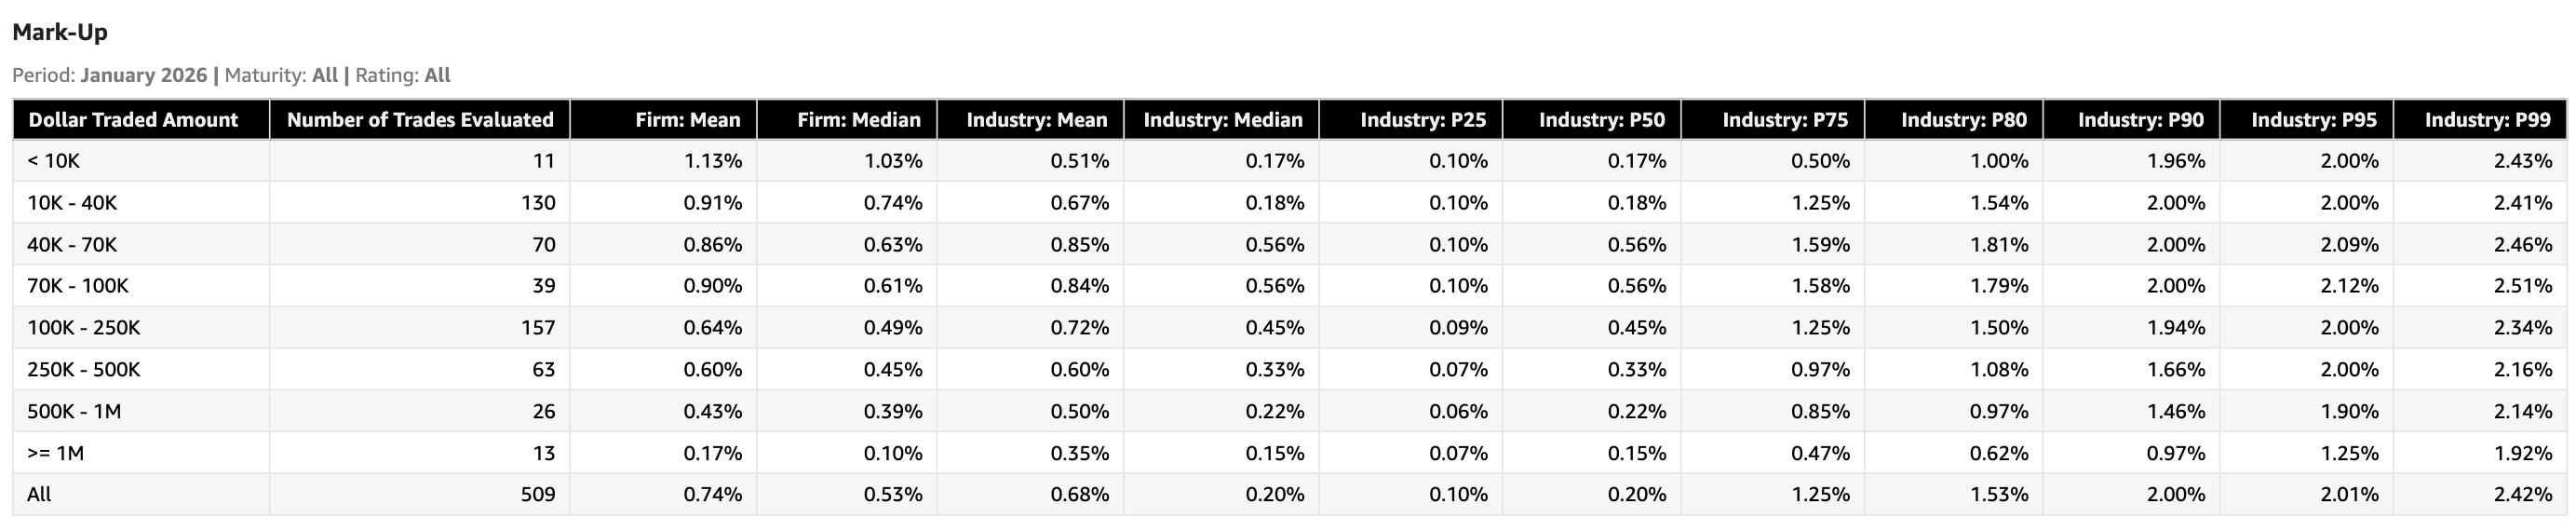
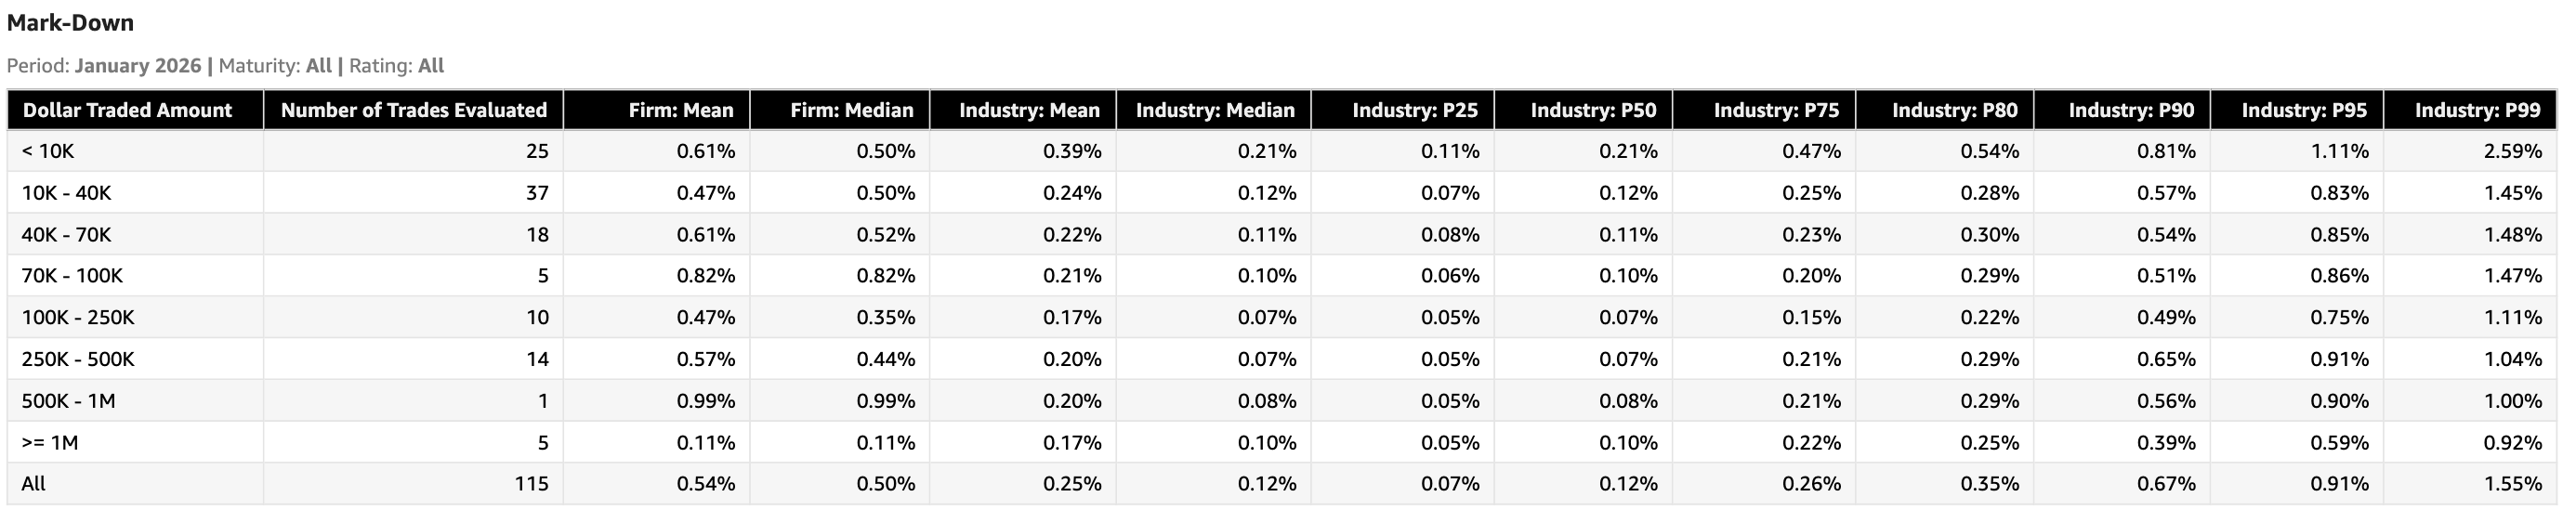
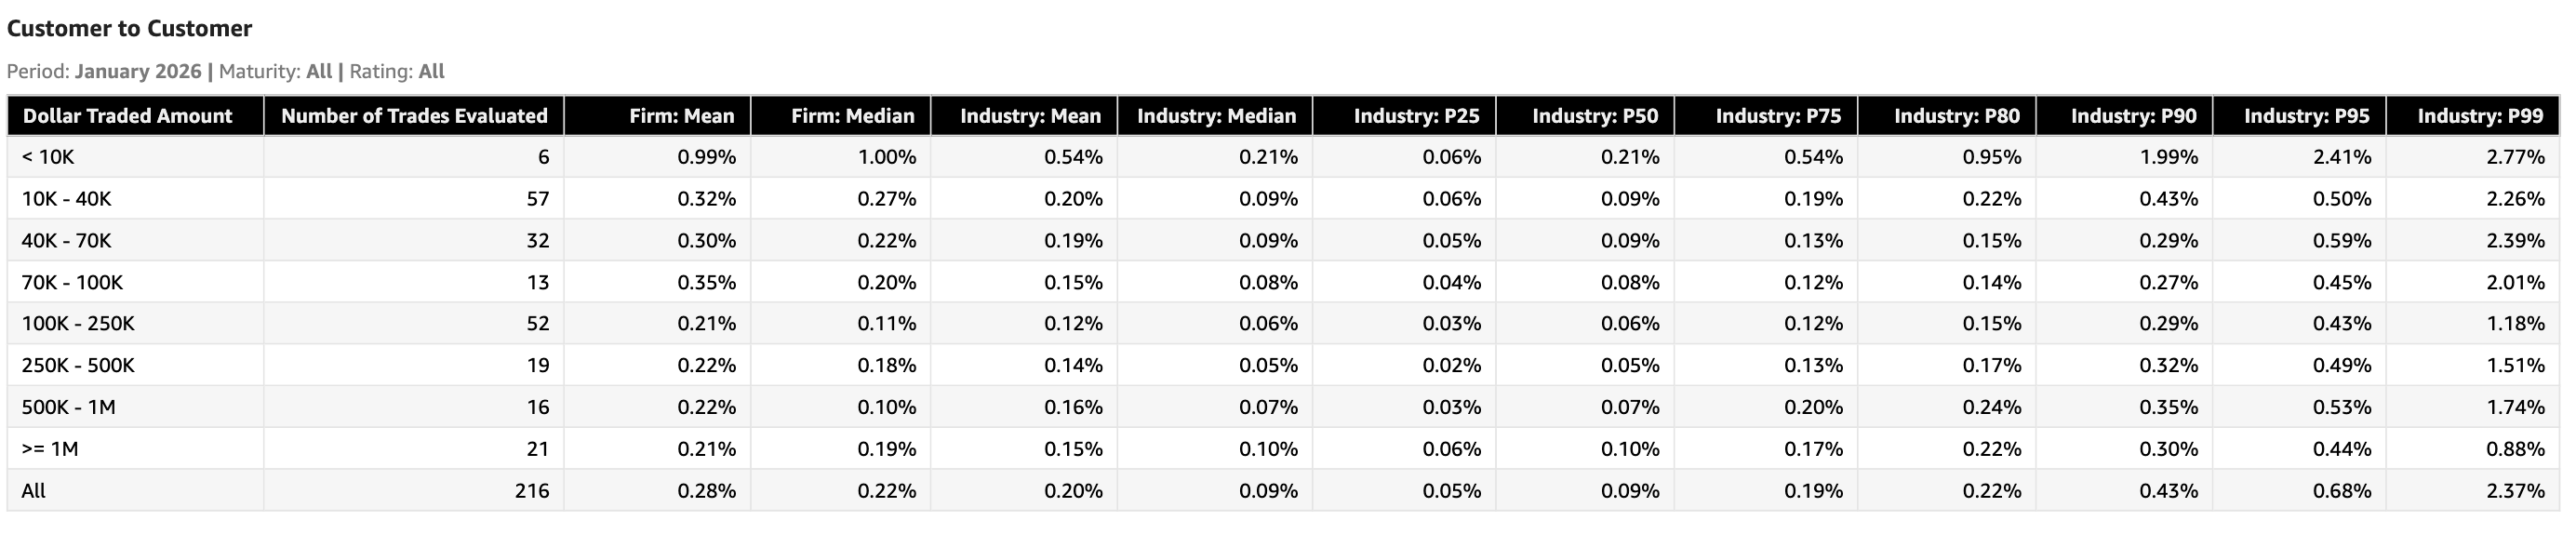
The Industry Benchmark tab provides high-level statistics regarding your firm’s pricing activity in the context of industry pricing statistics. Specifically, for a period and view configured in the Control Panel, the Industry Benchmark tab provides statistics regarding member Mark-Up, Mark-Down, and Customer-to-Customer trade activity broken down in dollar traded amount tiers alongside corresponding industry statistics in the same categories. The individual tables detail the number of trades within each category, the firm’s percentage mean and median in each category, and the statistical distribution of percentage values in each category, including the industry mean, median, and percentiles from the 25th percentile to the 99th percentile. Each table is formatted as follows:

Industry Benchmark – Control Panel
The Control Panel at the top of the Industry Benchmark tab gives you the ability to configure the period, maturity, and rating of the data presented in the statistical tables.

- Period | the period selector shows the months for which industry benchmark data is available and allows you to select different months. The period selector defaults to the most recent available month.
- Maturity | the maturity selector defaults to all maturities and allows you to narrow the time to maturity of securities included in trades and statistics to the following:
- < 1 Year
- >= 1 year to < 5 years
- >= 5 years to < 10 years
- >= 10 years
- Rating | the rating selector defaults to all ratings, and enables you to narrow the rating of securities included in trades and statistics to the following:
- Investment Grade
- Non-Investment Grade
- Unrated
Industry Benchmark – Statistical Tables
The Industry Benchmark tab presents three statistical tables (i.e., Mark-Up, Mark-Down, Customer-to-Customer) that provide statistical information regarding paired trades for your firm in the context of industry statistics for similar trade activity. Specifically, the “Number of Trades Evaluated” column describes the count of trades evaluated for your firm within those trade types in dollar traded amount categories. The “Firm Mean” and “Firm Median” columns describe the statistical mean and median percent profit of the trades within those dollar-traded categories. The industry statistics columns provide the industry-wide percent profit for the mean, median, and percentiles from the 25th percentile to the 99th percentile within the dollar-traded amount categories.
Mark-Up
Mark-Down
Customer-to-Customer
Industry Benchmark – Interactivity
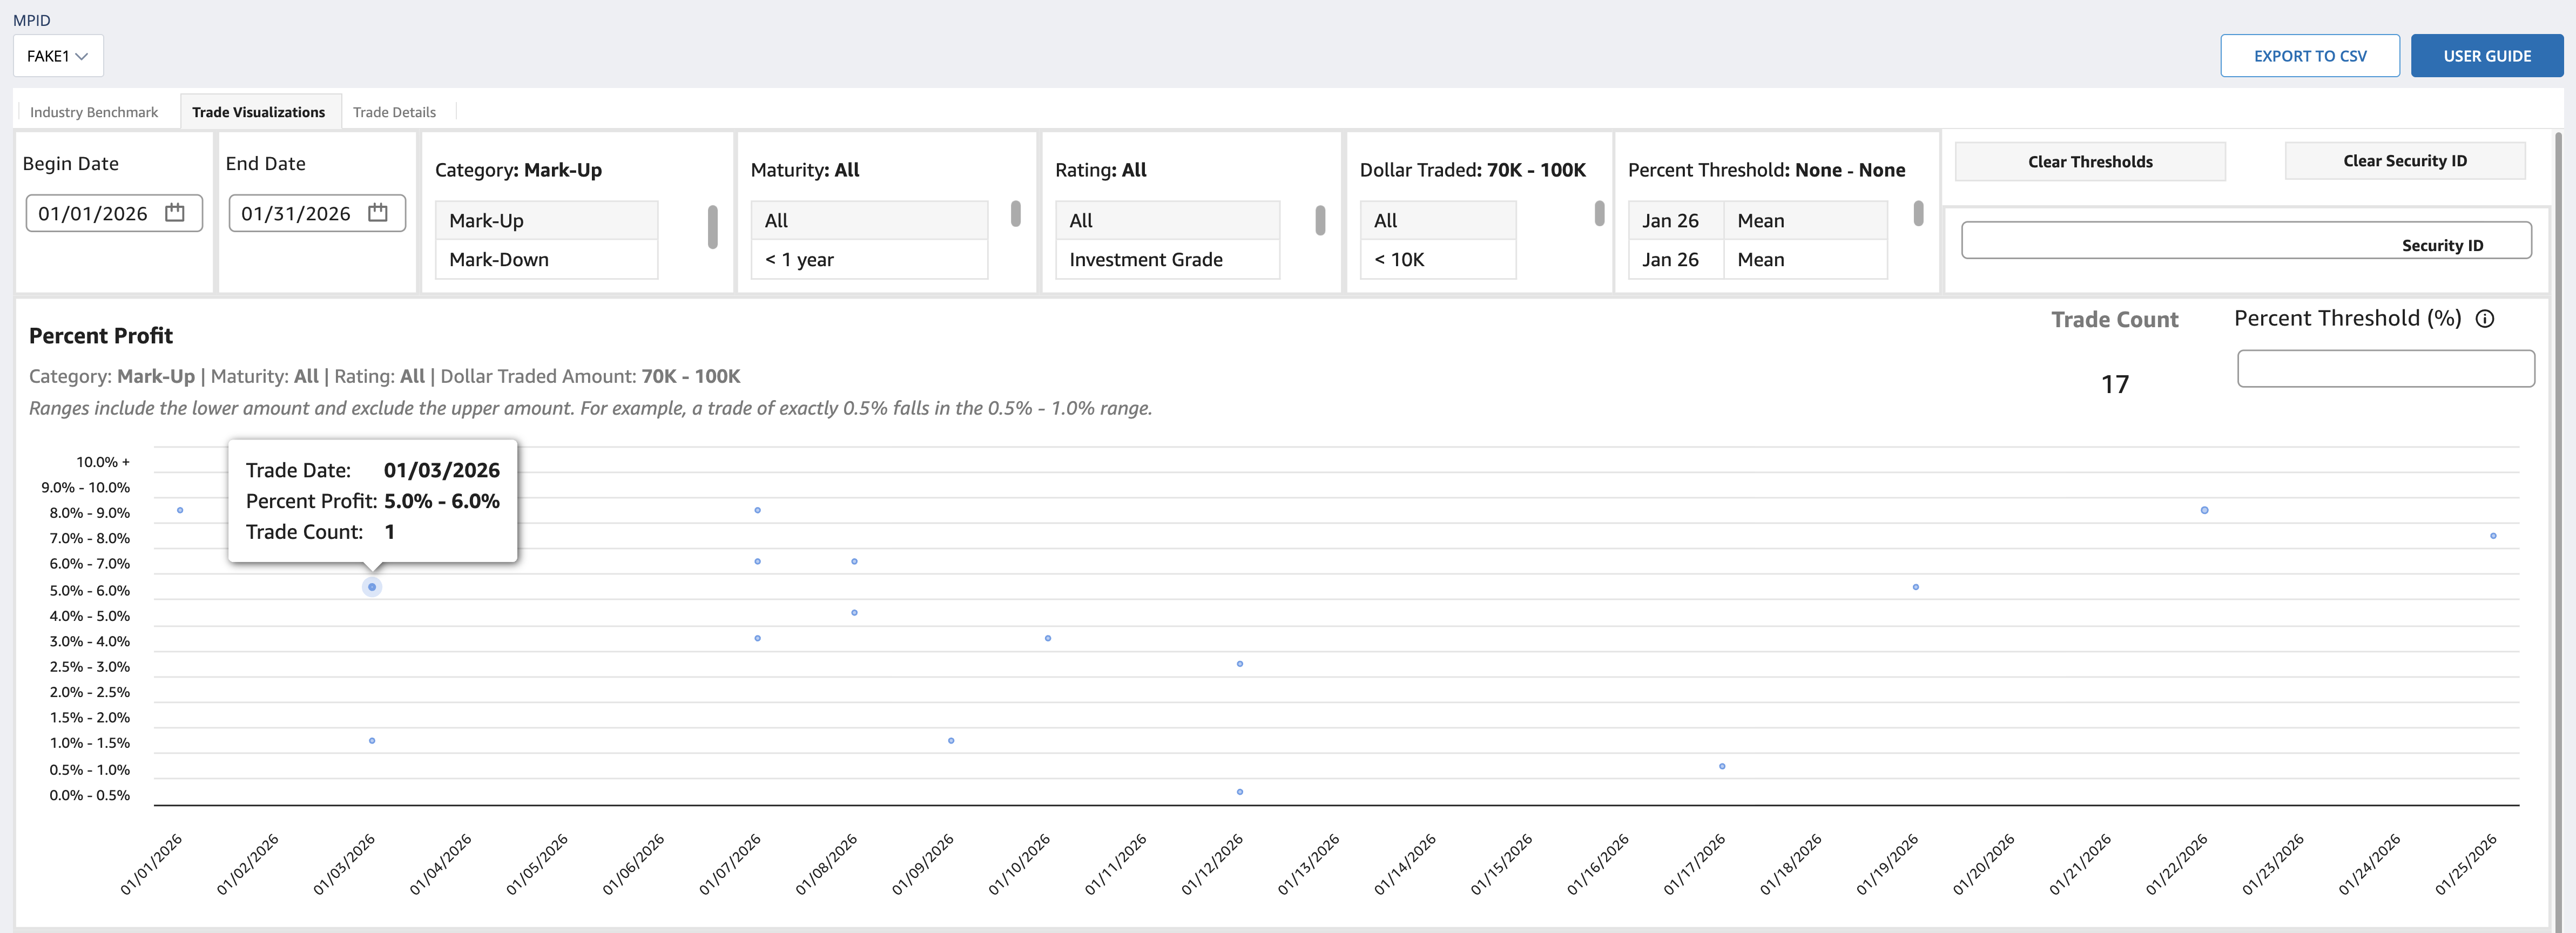
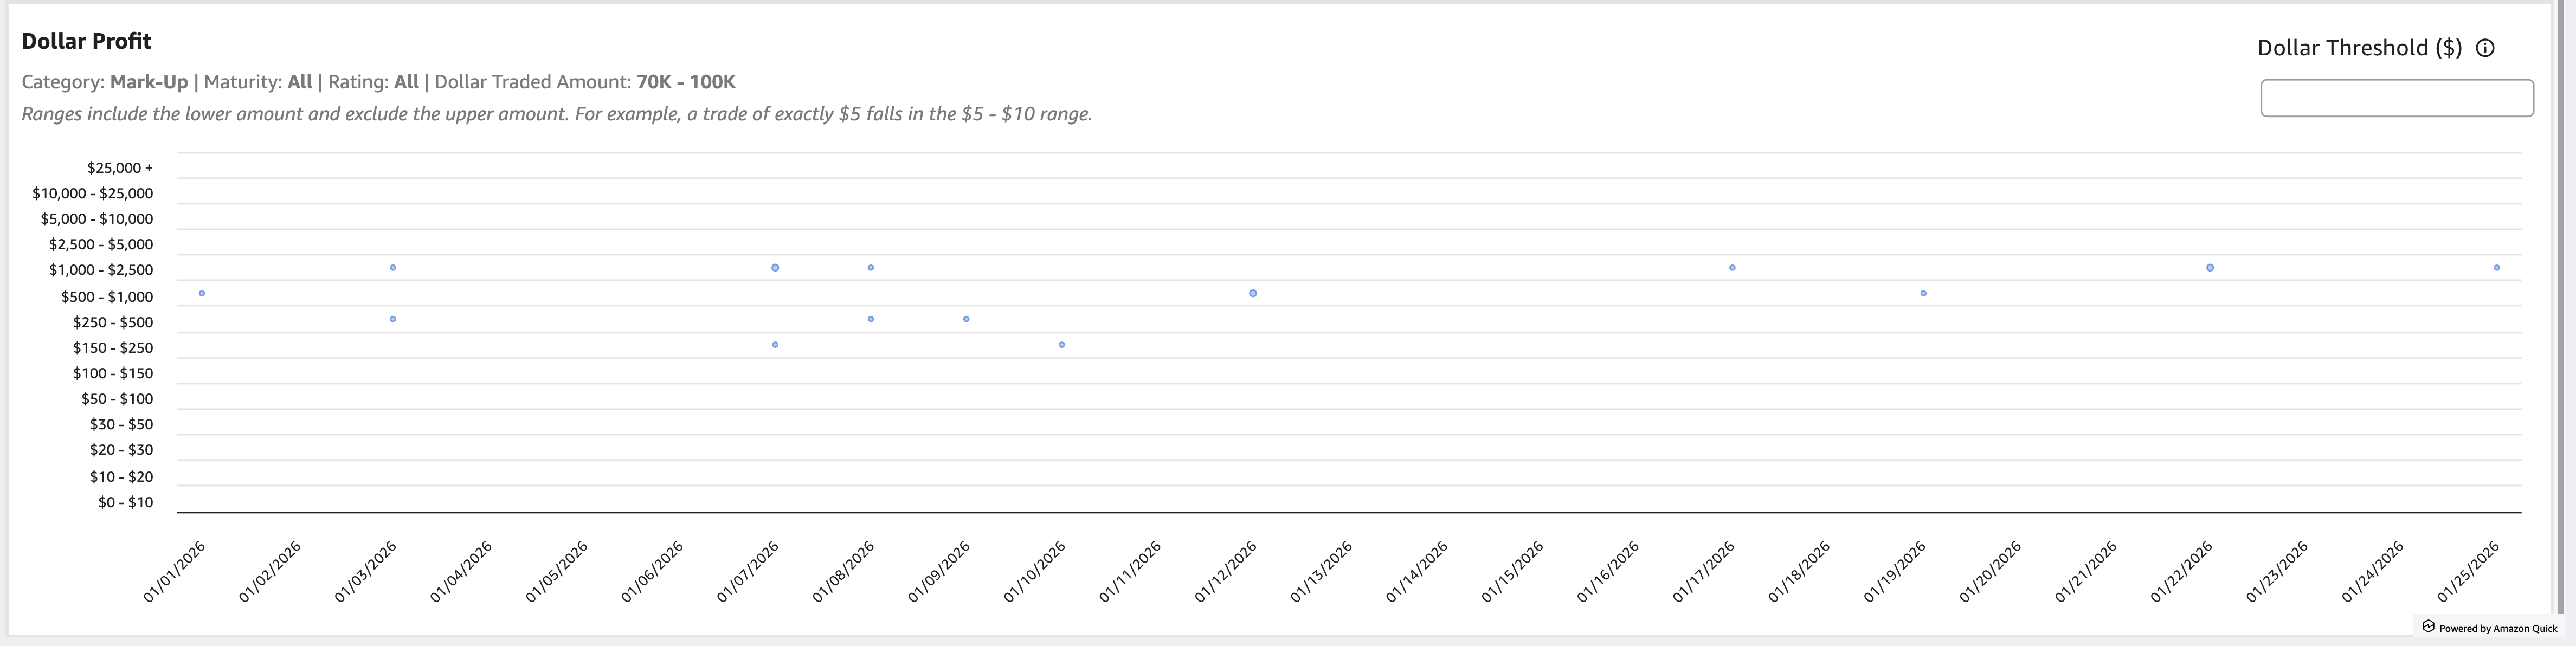
Selecting a row within any statistical table will load the Trade Visualizations (i.e., percent profit and dollar profit charts) and Trade Details associated with that row. For example, in the Mark-Up Statistical Table for the month of January 2026, clicking on the “40K – 70K” row of the Dollar Traded Amount opens the Trade Visualizations tab and presents your firm’s Mark-Up trades within the month of the statistical report:
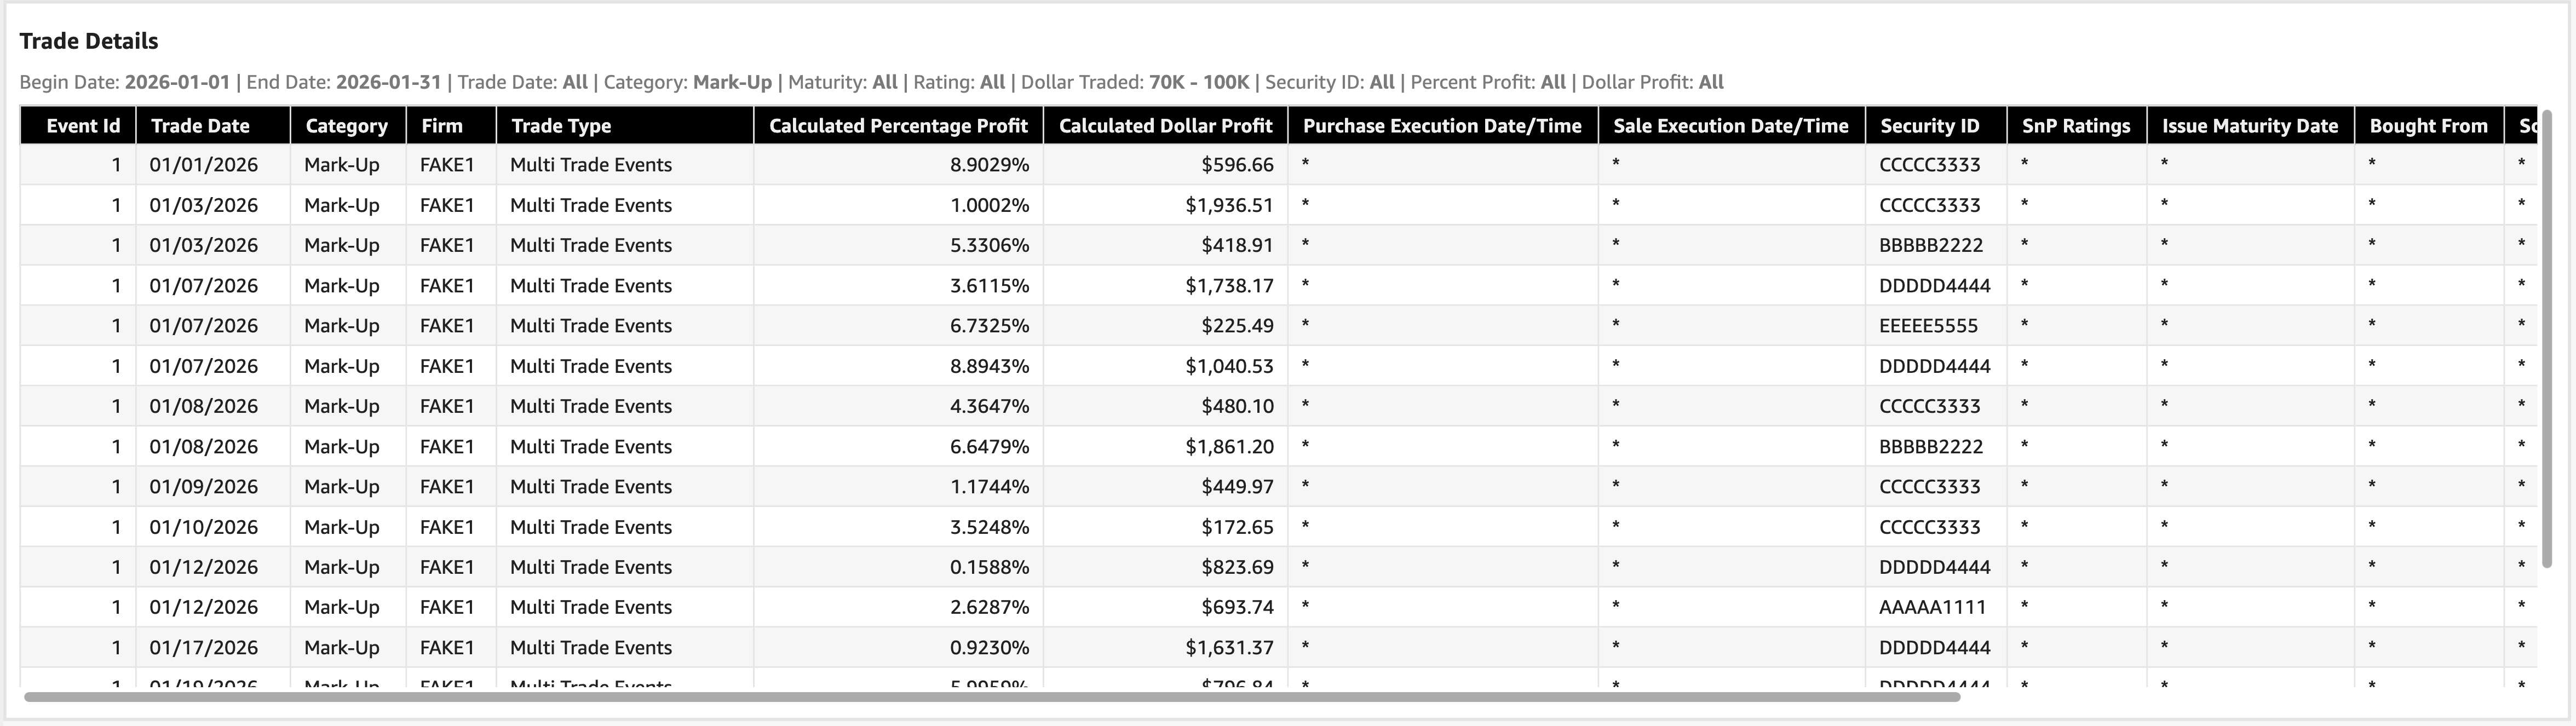
Also, the Trade Details tab pre-loads with the underlying trade detail from the row in the January 2026 Mark-Up 40K – 70K Dollar Traded Amount row:
Trade Visualizations
The Trade Visualizations tab dynamically visualizes trade pair information in percent profit and dollar profit charts, which are interactive and facilitate analysis. Unlike the Industry Benchmark tab, the Trade Visualizations tab is not a monthly data set. The MU/MD Indicators Dashboard visualizes and makes detail available regarding trade pairs available on a T+6 basis. Further, the Trade Visualizations tab has a configurable Begin and End Date, and the ability to drill through specific data points into the underlying trade details.
Trade Visualizations - Control Panel
The Trade Visualizations tab Control Panel presents members, on the top left, with a selectable Begin and End Date. The default Begin Date is the first day of the previous full month and the default End Date is the current date. For example, a user accessing the MU/MD Indicators Dashboard on Tuesday, October 14, 2025, would see a default Begin Date of September 1, 2025, and a default End Date of October 14, 2025. Members can adjust the date range to span across longer or shorter custom date ranges; the MU/MD Indicators Dashboard has data available back to January 1, 2025. The Begin and End Date dynamically drive the contents of interactive visualizations in the remainder of the Trade Visualizations tab.
Once the Begin and End Date are configured, the Control Panel facilitates the narrowing of the trade data that is visualized using the following categories:
- Category | the category selector narrows the trades displayed in the Trade Visualizations to Mark-Up, Mark-Down, or Customer-to-Customer trade pairs.
- Maturity | the maturity selector defaults to all maturities and allows you to narrow the time to maturity of securities included in trade data to the following:
- < 1 Year
- >= 1 year to < 5 years
- >= 5 years to < 10 years
- >= 10 years
- Rating | the rating selector defaults to all ratings, and enables you to narrow the rating of securities included in trades and statistics to the following:
- Investment Grade
- Non-Investment Grade
- Unrated
- Committee on Uniform Securities Identification Procedures (CUSIP) | A CUSIP is a unique nine-character alphanumeric identifier assigned to a financial instrument (such as a stock or bond) that enables accurate identification and processing of that security during trading, clearance, and settlement. Entering a CUSIP into the Control Panel narrows the Trade Visualizations to firm trades in that CUSIP.
The Percent Threshold category is different in kind from the above Control Panel elements in that it does not narrow the trades presented but color codes the Trade Data Visualization Percent Profit data points in a way that identifies paired trades with profit percentages above that threshold. You can apply a metric to the chart in two ways. First, you can select an industry metric, such as the January 2026 75th percentile of profit percentage, to overlay on the Percent Profit chart:
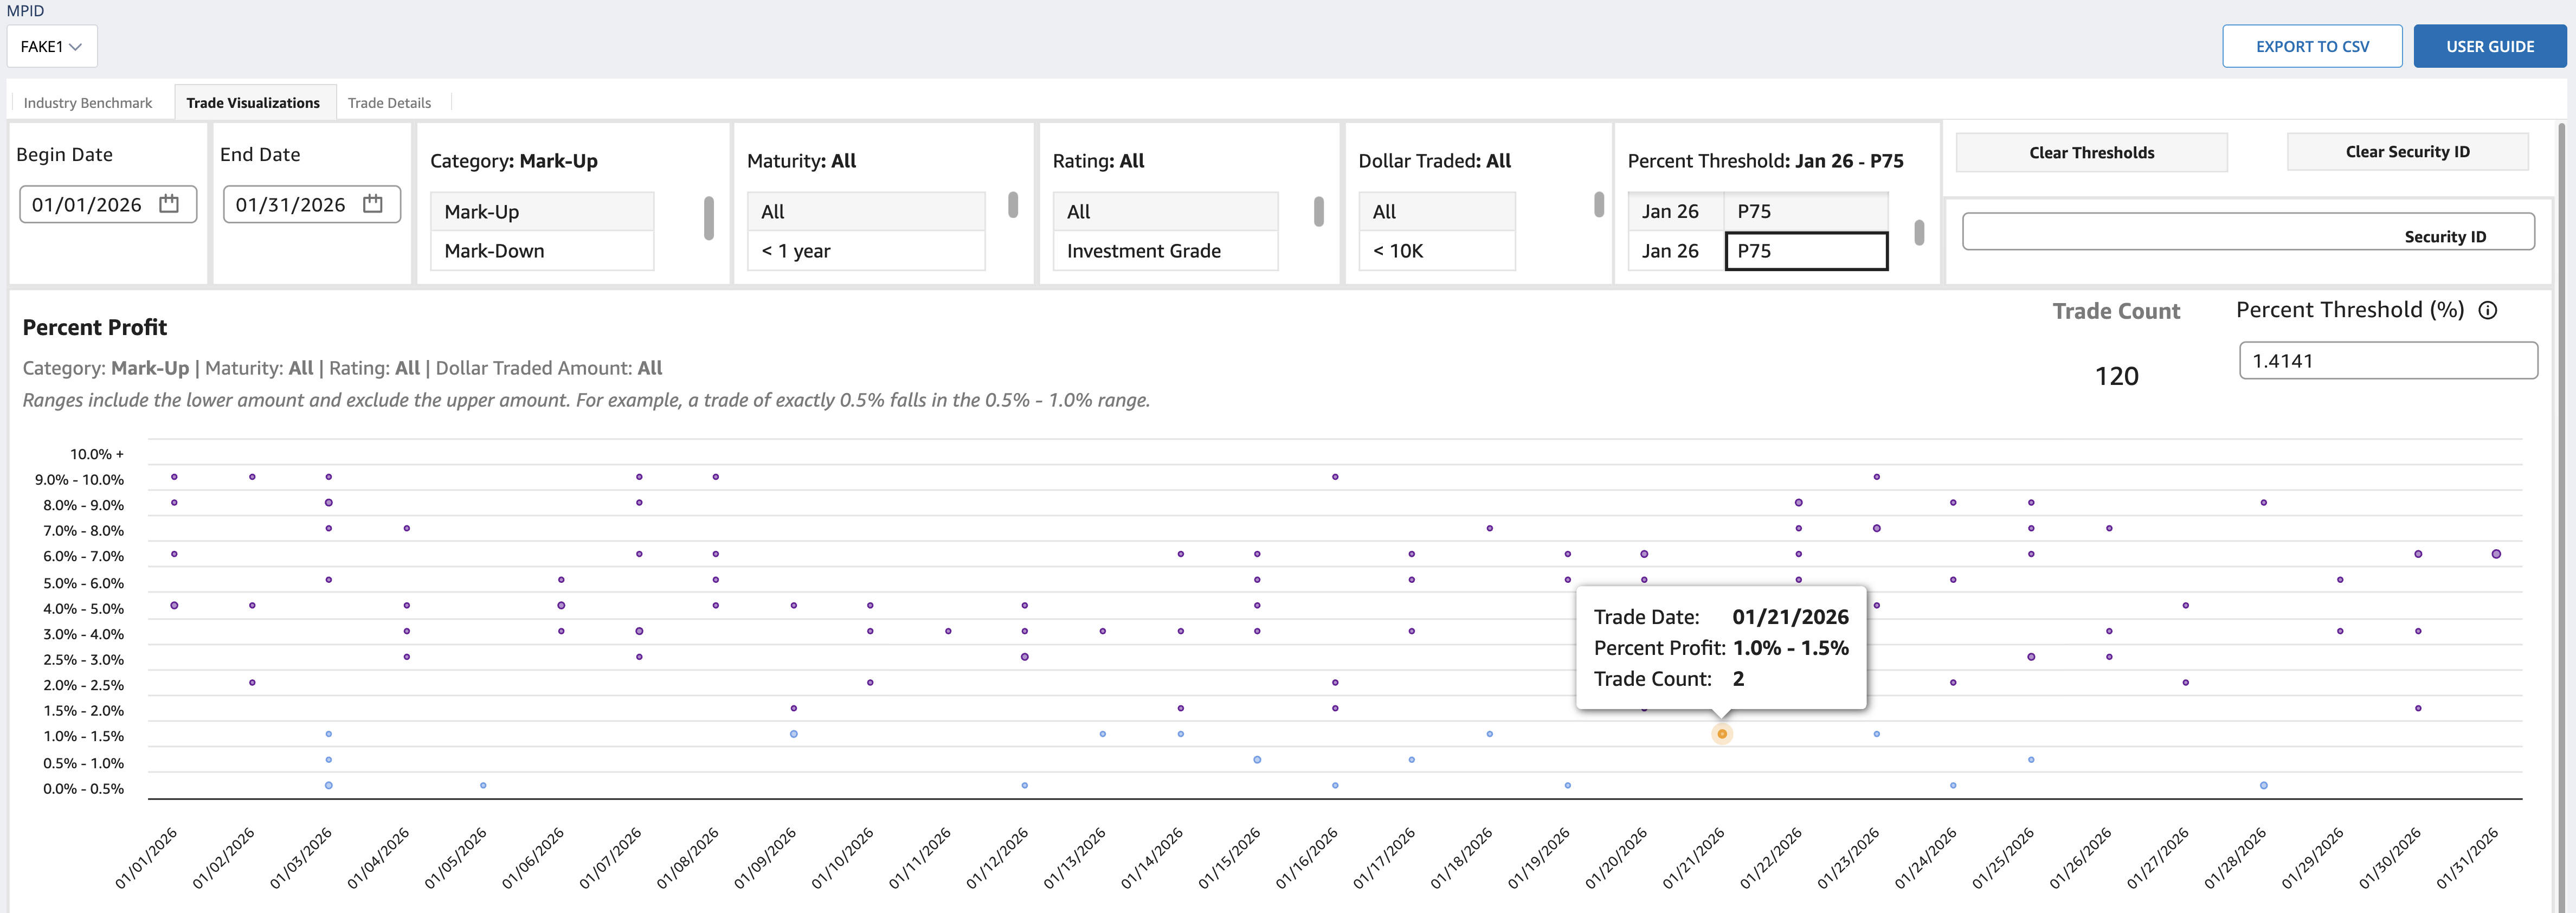
This color codes all trades that exceed the 75th percentile from January 2026 (1.4141%) for the relevant period in purple. Second, you can enter a custom percent in the Percent Threshold (%) box in the upper right-hand corner of the Percent Profit chart. With both methods, where a Percent Threshold is below the maximum and above the minimum of a specific percent profit bucket (e.g., 1.5 – 2%), the Percent Profit chart will color code that data point in orange.
Trade Visualizations – Percent & Dollar Profit Charts
The Percent and Dollar profit charts visualize trade pairs in two ways: the top chart displays the number of trade pairs that fell within a specific range as a percentage that reflects profit to your firm as a percentage of the trade pair; the bottom chart reflects the number of trade pairs that fell within a specific dollar profit range.
Percent Profit Chart
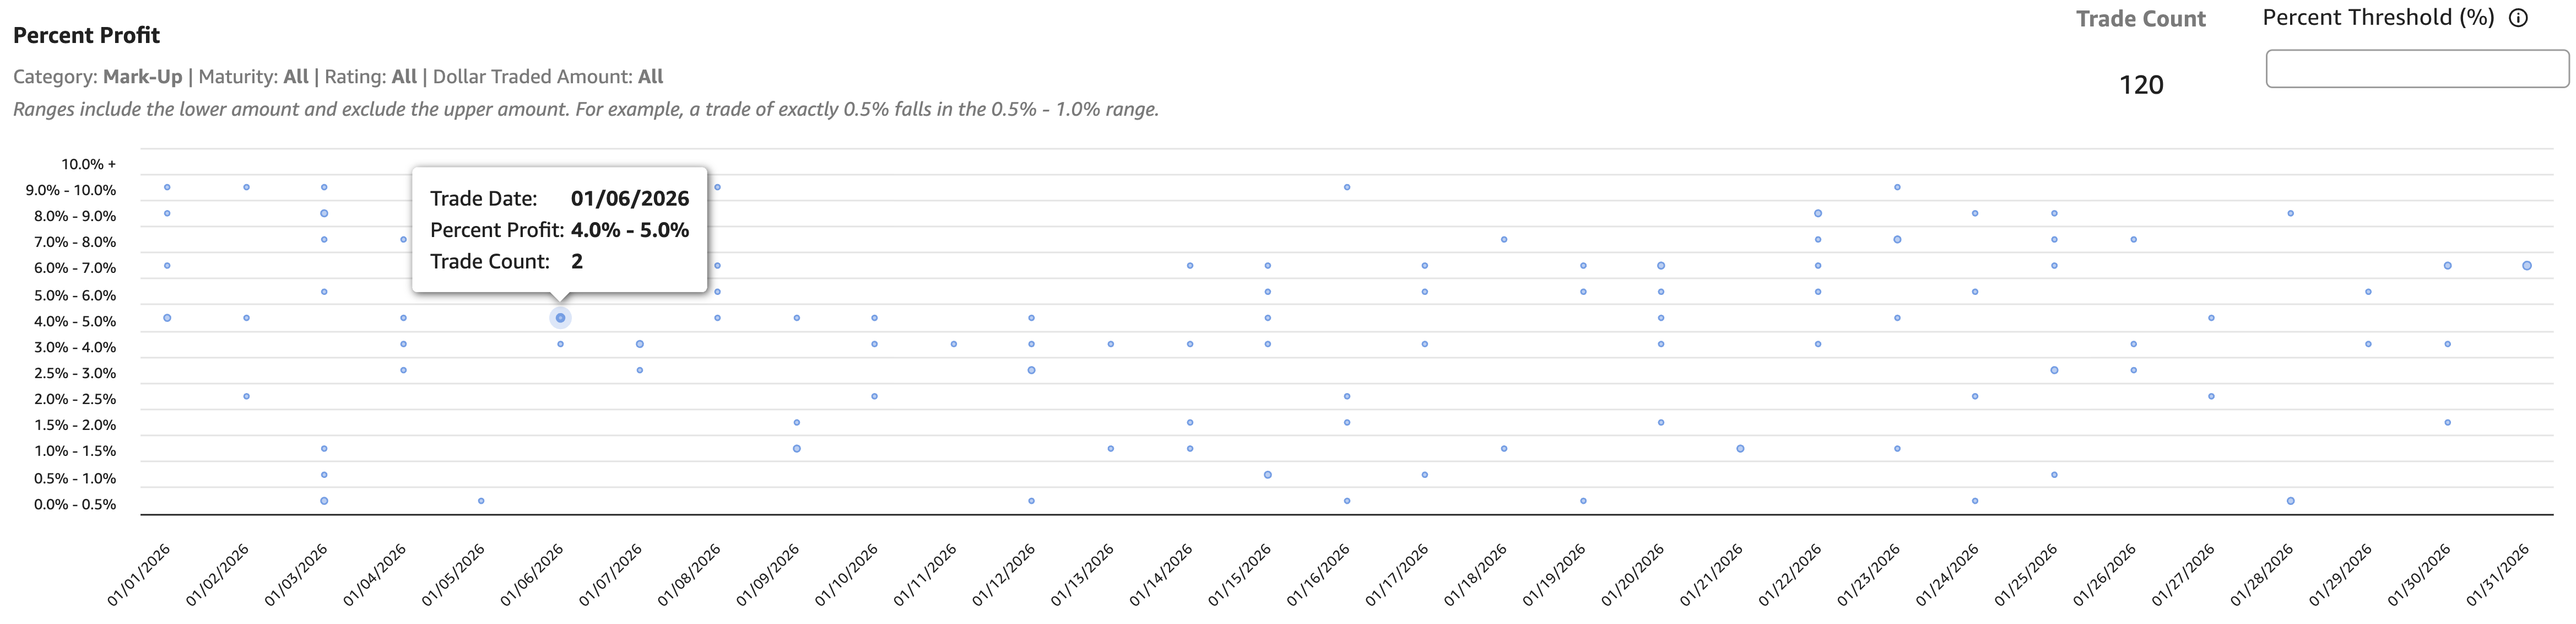
Following the settings configured in the Trade Visualizations Control Panel, the Percent Profit chart displays a bubble plot showing the number of paired trades calculated profit percentage that fall within one of the fourteen percent profit ranges.
| # | Range (%-%) | Width (%) |
|---|---|---|
| 1 | 0.0% - 0.5% | 0.50% |
| 2 | 0.5% - 1.0% | 0.50% |
| 3 | 1.0% - 1.5% | 0.50% |
| 4 | 1.5% - 2.0% | 0.50% |
| 5 | 2.0% - 2.5% | 0.50% |
| 6 | 2.5% - 3.0% | 0.50% |
| 7 | 3.0% - 4.0% | 1.00% |
| 8 | 4.0% - 5.0% | 1.00% |
| 9 | 5.0% - 6.0% | 1.00% |
| 10 | 6.0% - 7.0% | 1.00% |
| 11 | 7.0% - 8.0% | 1.00% |
| 12 | 8.0% - 9.0% | 1.00% |
| 13 | 9.0% - 10.0% | 1.00% |
| 14 | 10.0%+ | open-ended |
Note, the percent profit ranges are more granular closer to zero percent profit and broader as they approach the top range, which captures all trade pairs that equal or exceed 10 percent profit. The visualization increases the size of the data plot based on the number of paired trades that occurred within that range. Hovering over a data point shows how many trade pairs occurred within that specific percent profit range (e.g., 4.0% - 5.0%) on that day. Clicking through a data point opens the details associated with the underlying trade pair(s) in the Trade Details tab.
Dollar Profit Chart
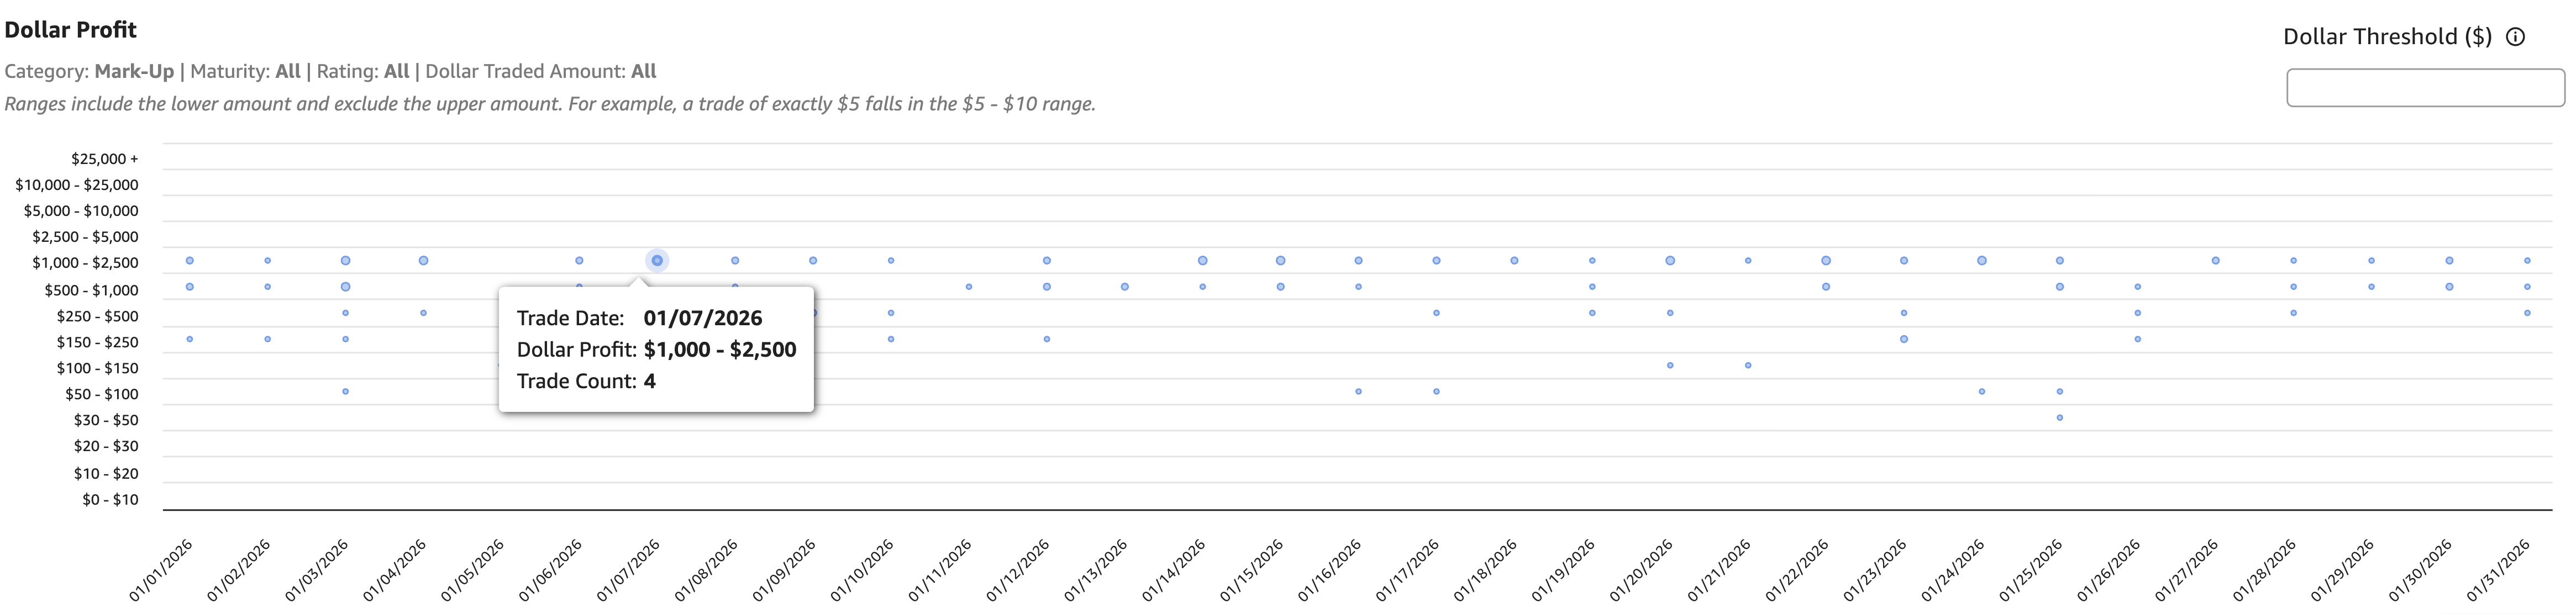
Following the settings configured in the Trade Visualizations Control Panel, the Dollar Profit chart displays a bubble plot of the number of paired trades calculated dollar profit that fall within one of the fourteen dollar profit ranges.
| # | Range ($-$) | Width ($) |
|---|---|---|
| 1 | $0 – $10 | $10 |
| 2 | $10 – $20 | $10 |
| 3 | $20 – $30 | $10 |
| 4 | $30 – $50 | $20 |
| 5 | $50 – $100 | $50 |
| 6 | $100 – $150 | $50 |
| 7 | $150 – $250 | $100 |
| 8 | $250 – $500 | $250 |
| 9 | $500 – $1000 | $500 |
| 10 | $1,000 – $2,500 | $1,500 |
| 11 | $2,500 – $5,000 | $2,500 |
| 12 | $5,000 – $10,000 | $5,000 |
| 13 | $10,000 – $25,000 | $15,000 |
| 14 | $25,000+ | open-ended |
Note, the dollar profit ranges are more granular closer to zero dollars and broader as they approach the top range, which captures all trade pairs that equal or exceed $25,000 in profit. The visualization increases the size of the data plot based on the number of paired trades that occurred within that range. Hovering over a data point shows how many trade pairs occurred within that dollar profit range (e.g., $5,000 – $10,000) on that day. Clicking through a data point opens the details associated with the underlying trade pair(s) in the Trade Details tab.
Trade Details
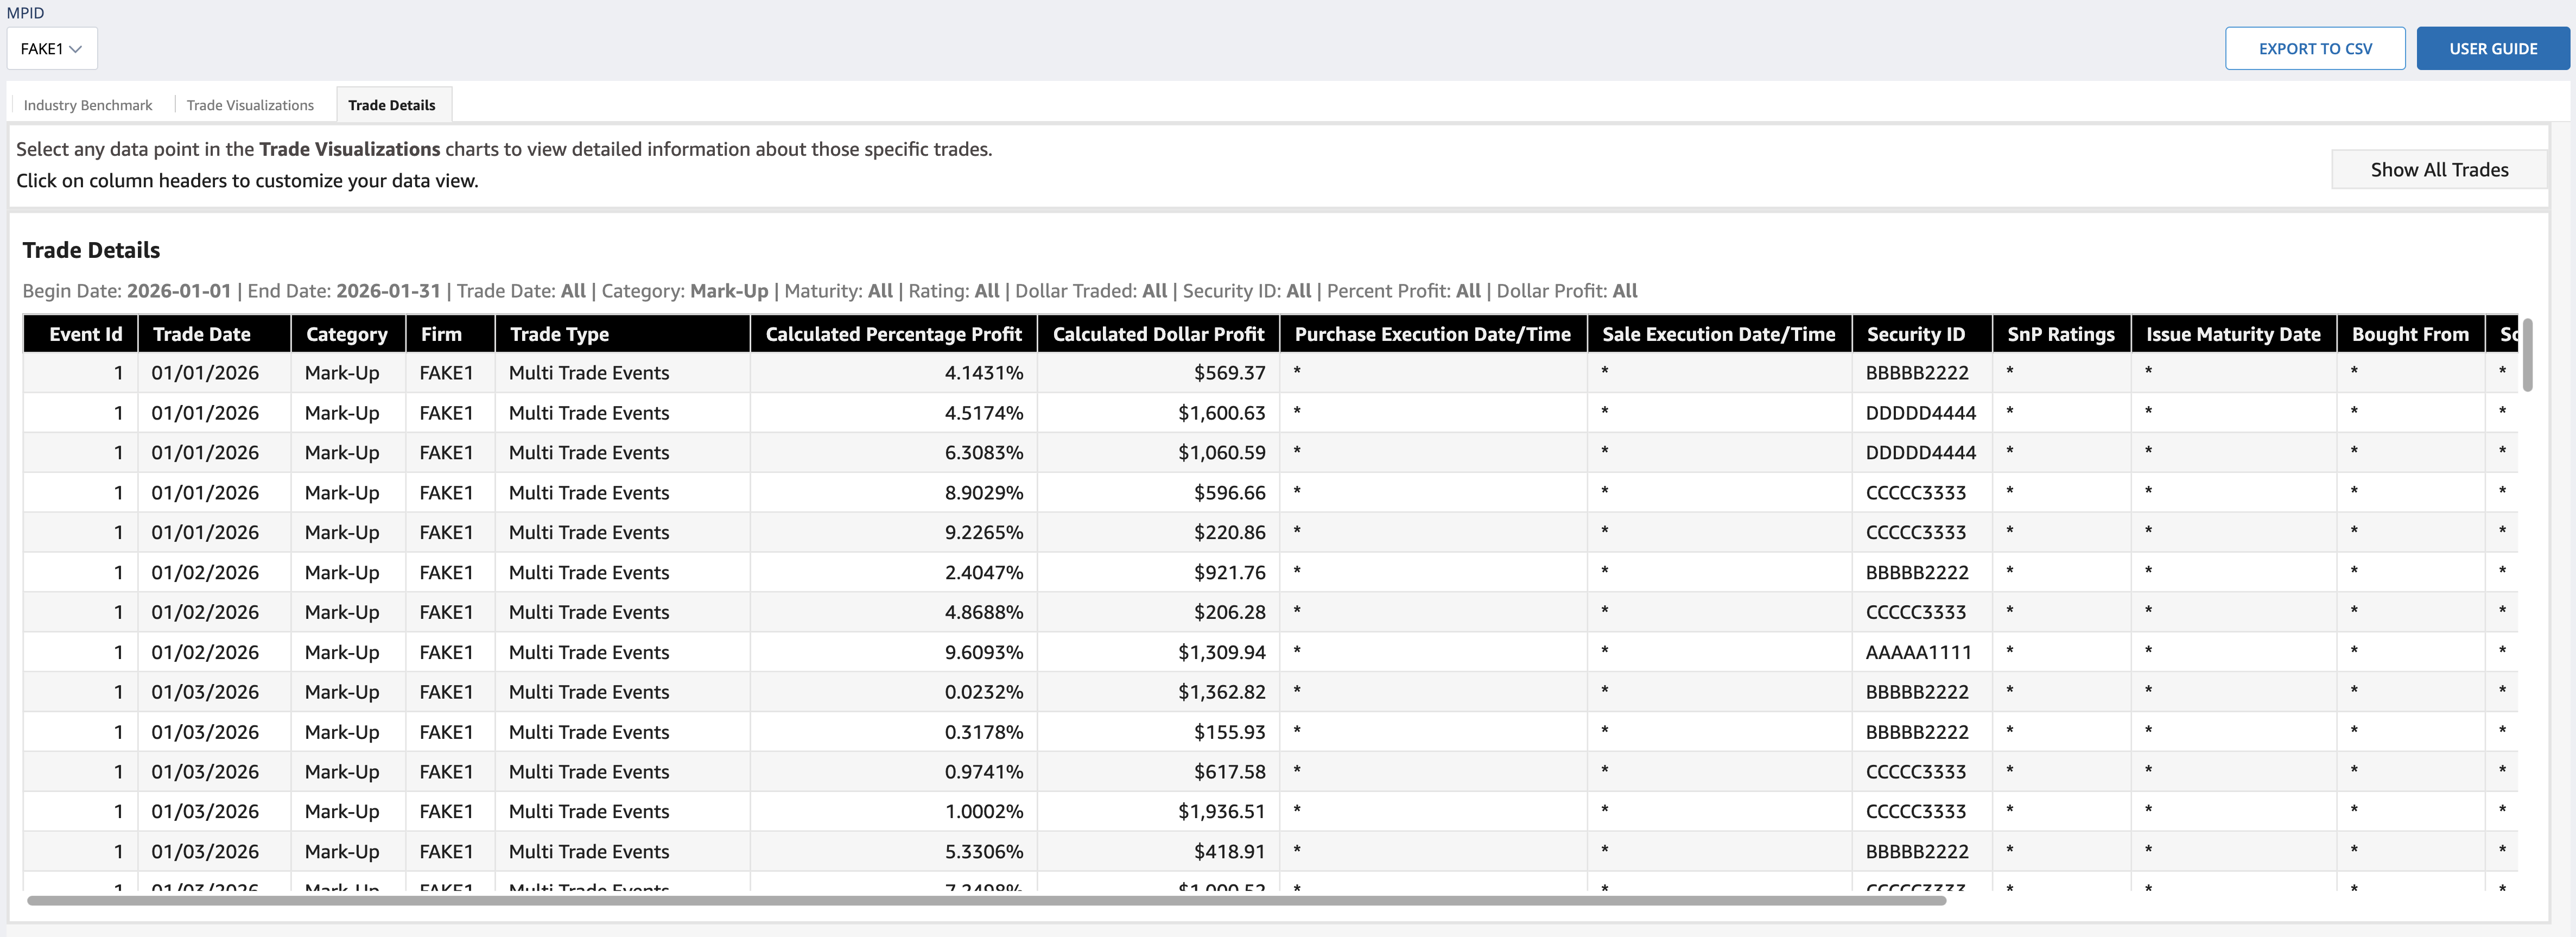
The Trade Details tab supports deeper analysis of a trade pair. Specifically, it provides a table of detailed information regarding the trade pairs for analysis within the dashboard or export to your systems, which enables communication and analysis away from the dashboard. The Trade Details tab automatically populates trades within the date range selected in the Industry Benchmark or Trade Visualizations tab Control Panels. It also narrows the results to a specific Percent Profit or Dollar Profit on a specific trade date when you select that data point on a Trade Data Visualization bubble plot. The column descriptions are outlined below in the Export to CSV section. Importantly, if the results include more than 500 trade pairs, the Trade Details tab paginates the output.
Export to CSV
The Export to CSV function allows member firms to analyze dashboard data outside the MU/MD Indicators Dashboard. For example, by facilitating internal root cause analysis or enriching indicator data with additional member-specific information to facilitate analysis.
To access CSV data, select the Export to CSV button at the top of the MU/MD Indicators Dashboard.
Once selected, a dialog box will appear showing the selected filters based on your current Control Panel settings. The Export Data dialog box allows you to refine the data export by changing any of the configurable fields or deselecting individual data sets.
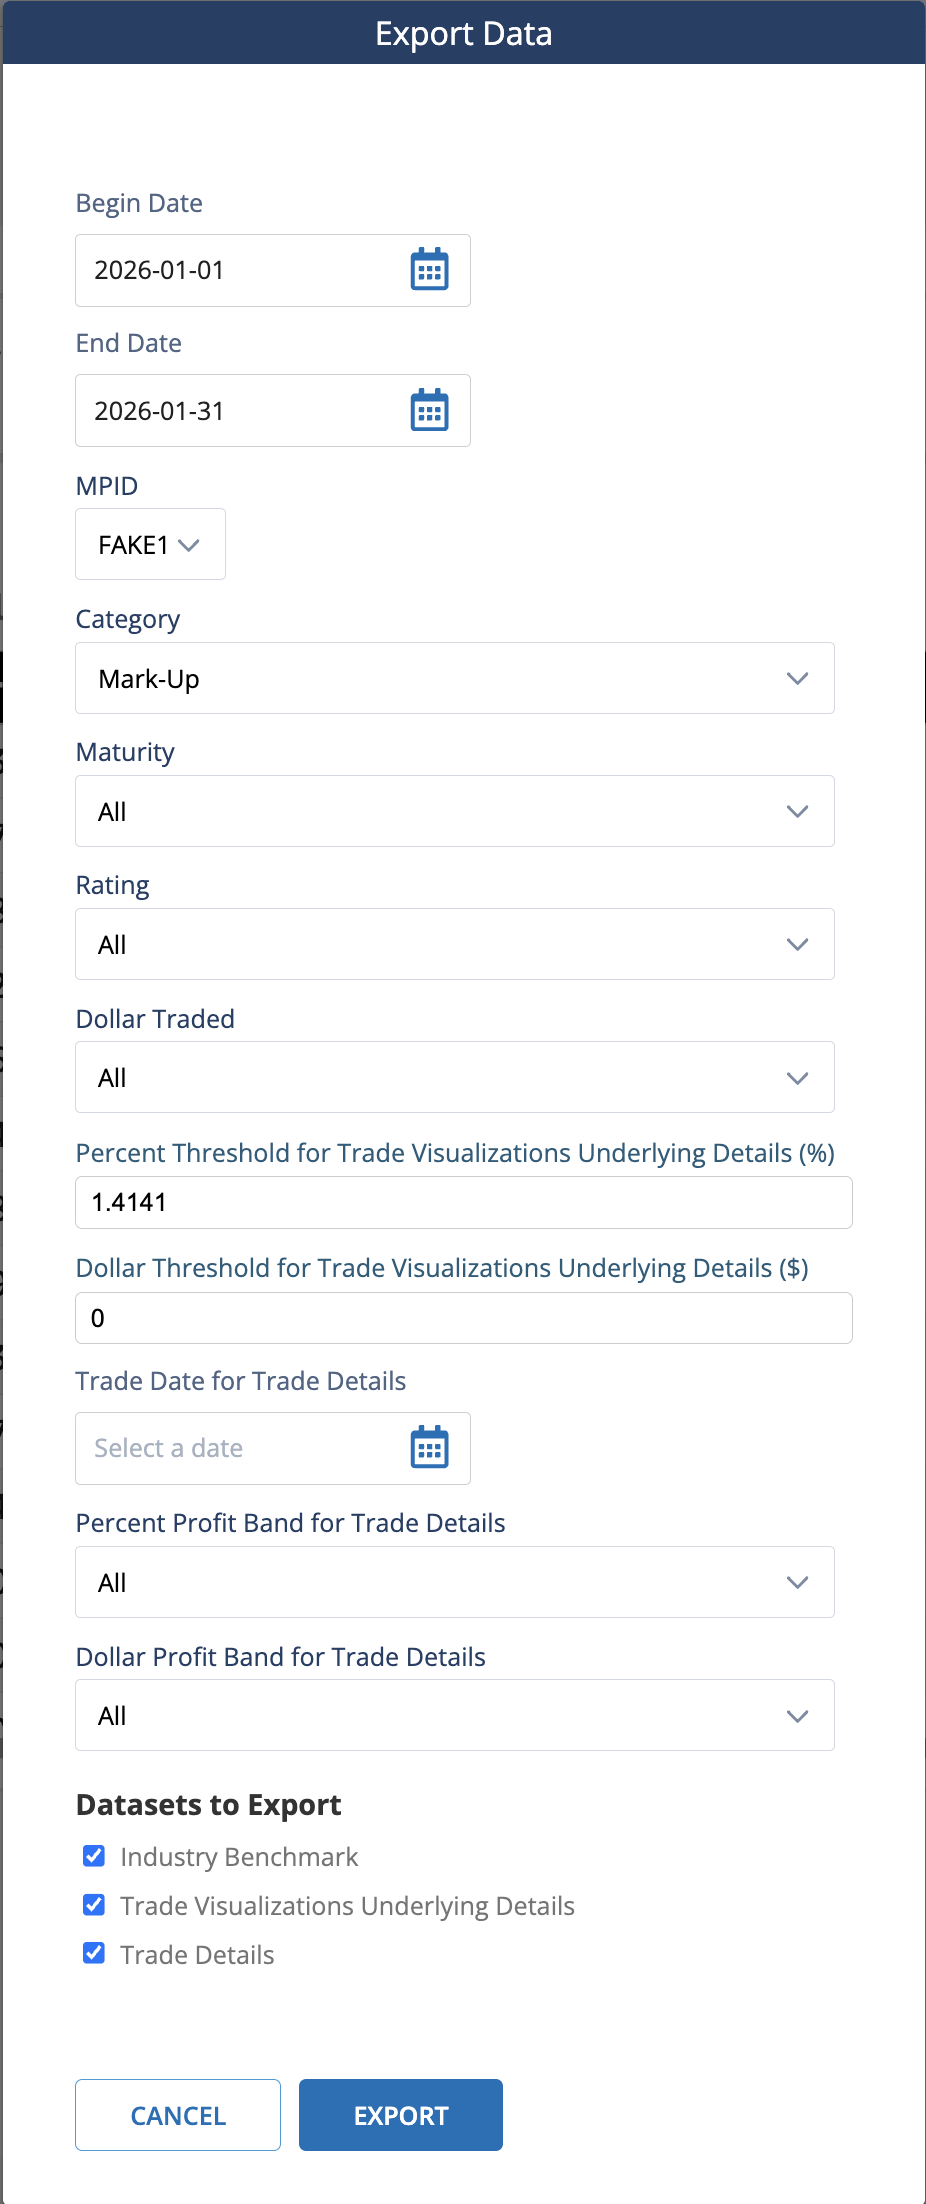
The Export to CSV Reference Table section below outlines the attributes in the Export Data dialog box. Importantly, the Export Data dialog box initially includes settings you have applied during your MU/MD Indicators session, such as specific security Maturity or Rating selections.
To download the datasets you have selected, click the Export button in the bottom right of the dialog box. You will see an Export Queued dialog in the bottom right of the screen. Once the processing is complete, select download to save a downloadable .zip file to your machine. These files are also available for download in the Exports tab after processing.
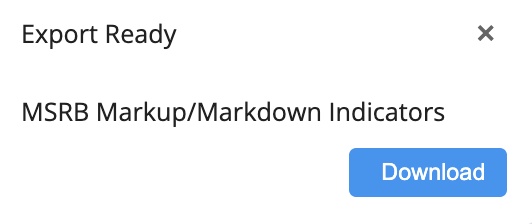
The download is a .zip folder that contains Comma Separated Value (CSV) files: a “manifest” file that describes the details of the export (e.g., Begin Date, End Date, MPID, etc.); and files that correspond to the datasets you have selected to export (i.e., Industry Benchmark, Trade Visualizations Underlying Details, and Trade Details). You can find the file layouts for these data sets in the below Export File Layouts section.
Self-Set Notifications
As a supplement to the MU/MD Indicators Dashboard features, FINRA offers a self-set notification feature that empowers individual users to customize when and how they engage with the MU/MD Indicators Dashboard based on their specific roles and needs.
How to Set Up Notifications
From within the MU/MD Indicators Dashboard, navigate to “Self-Set Notifications” in the top banner and select “Add Notification Rule.”
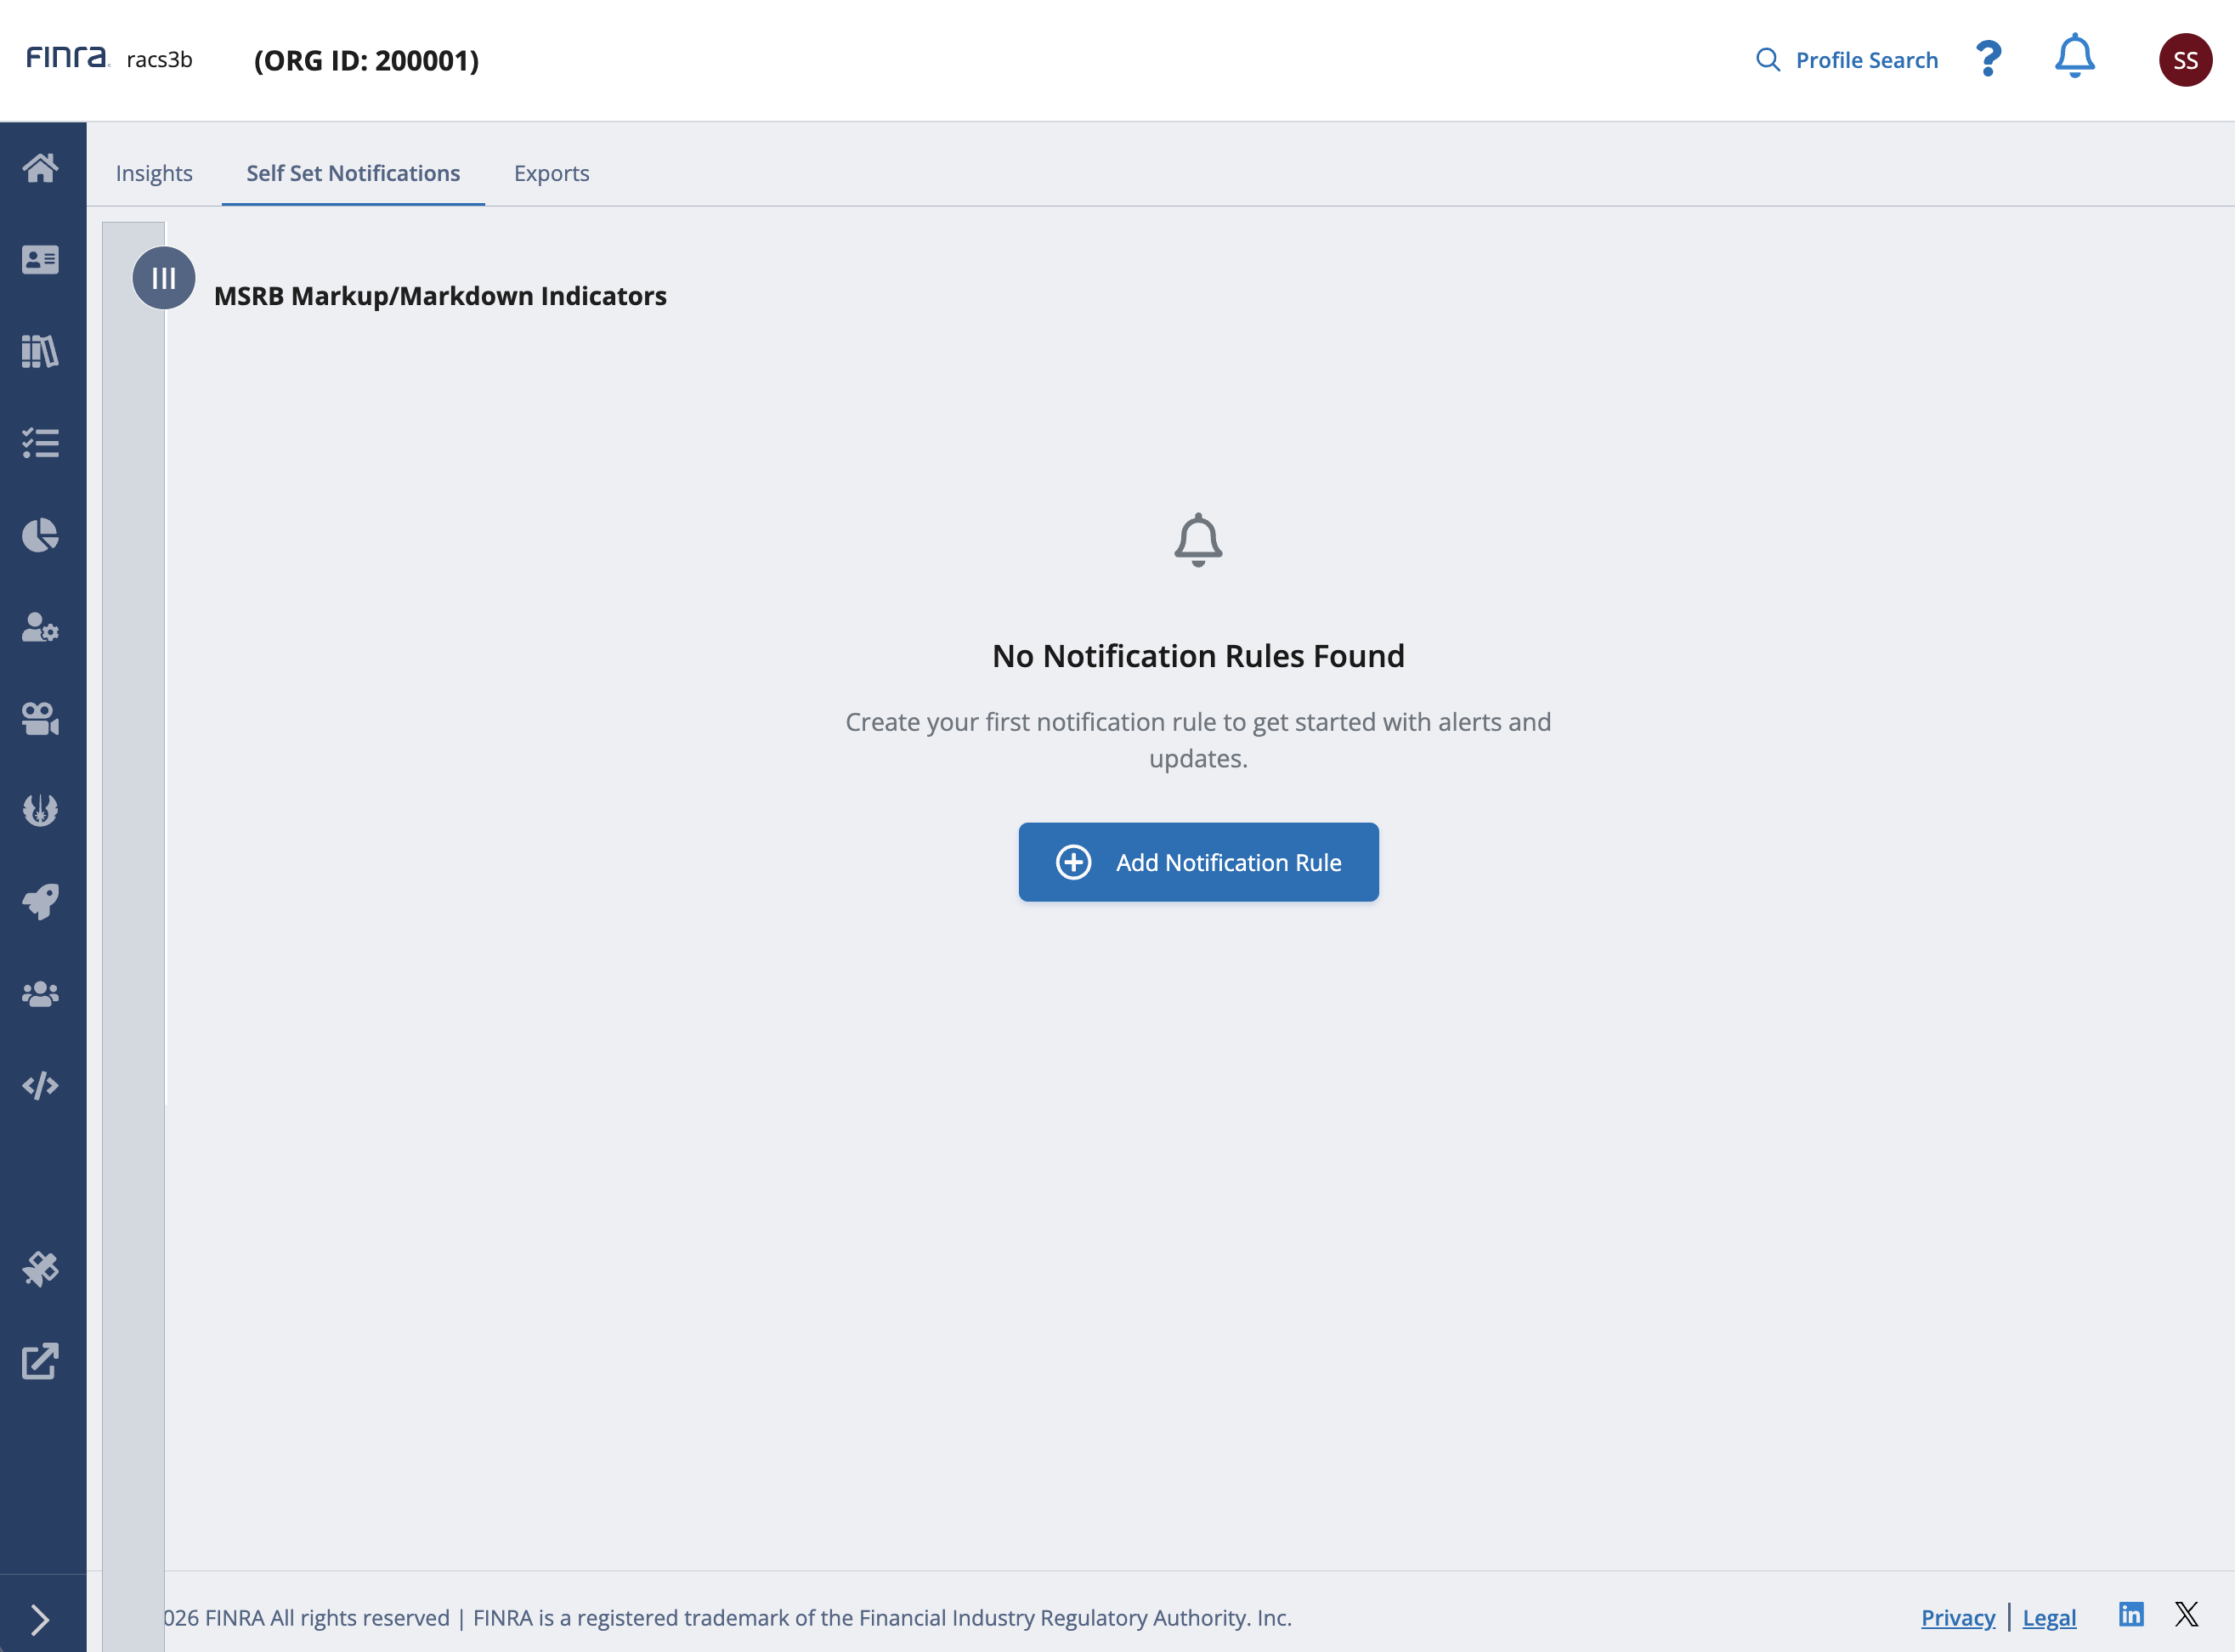
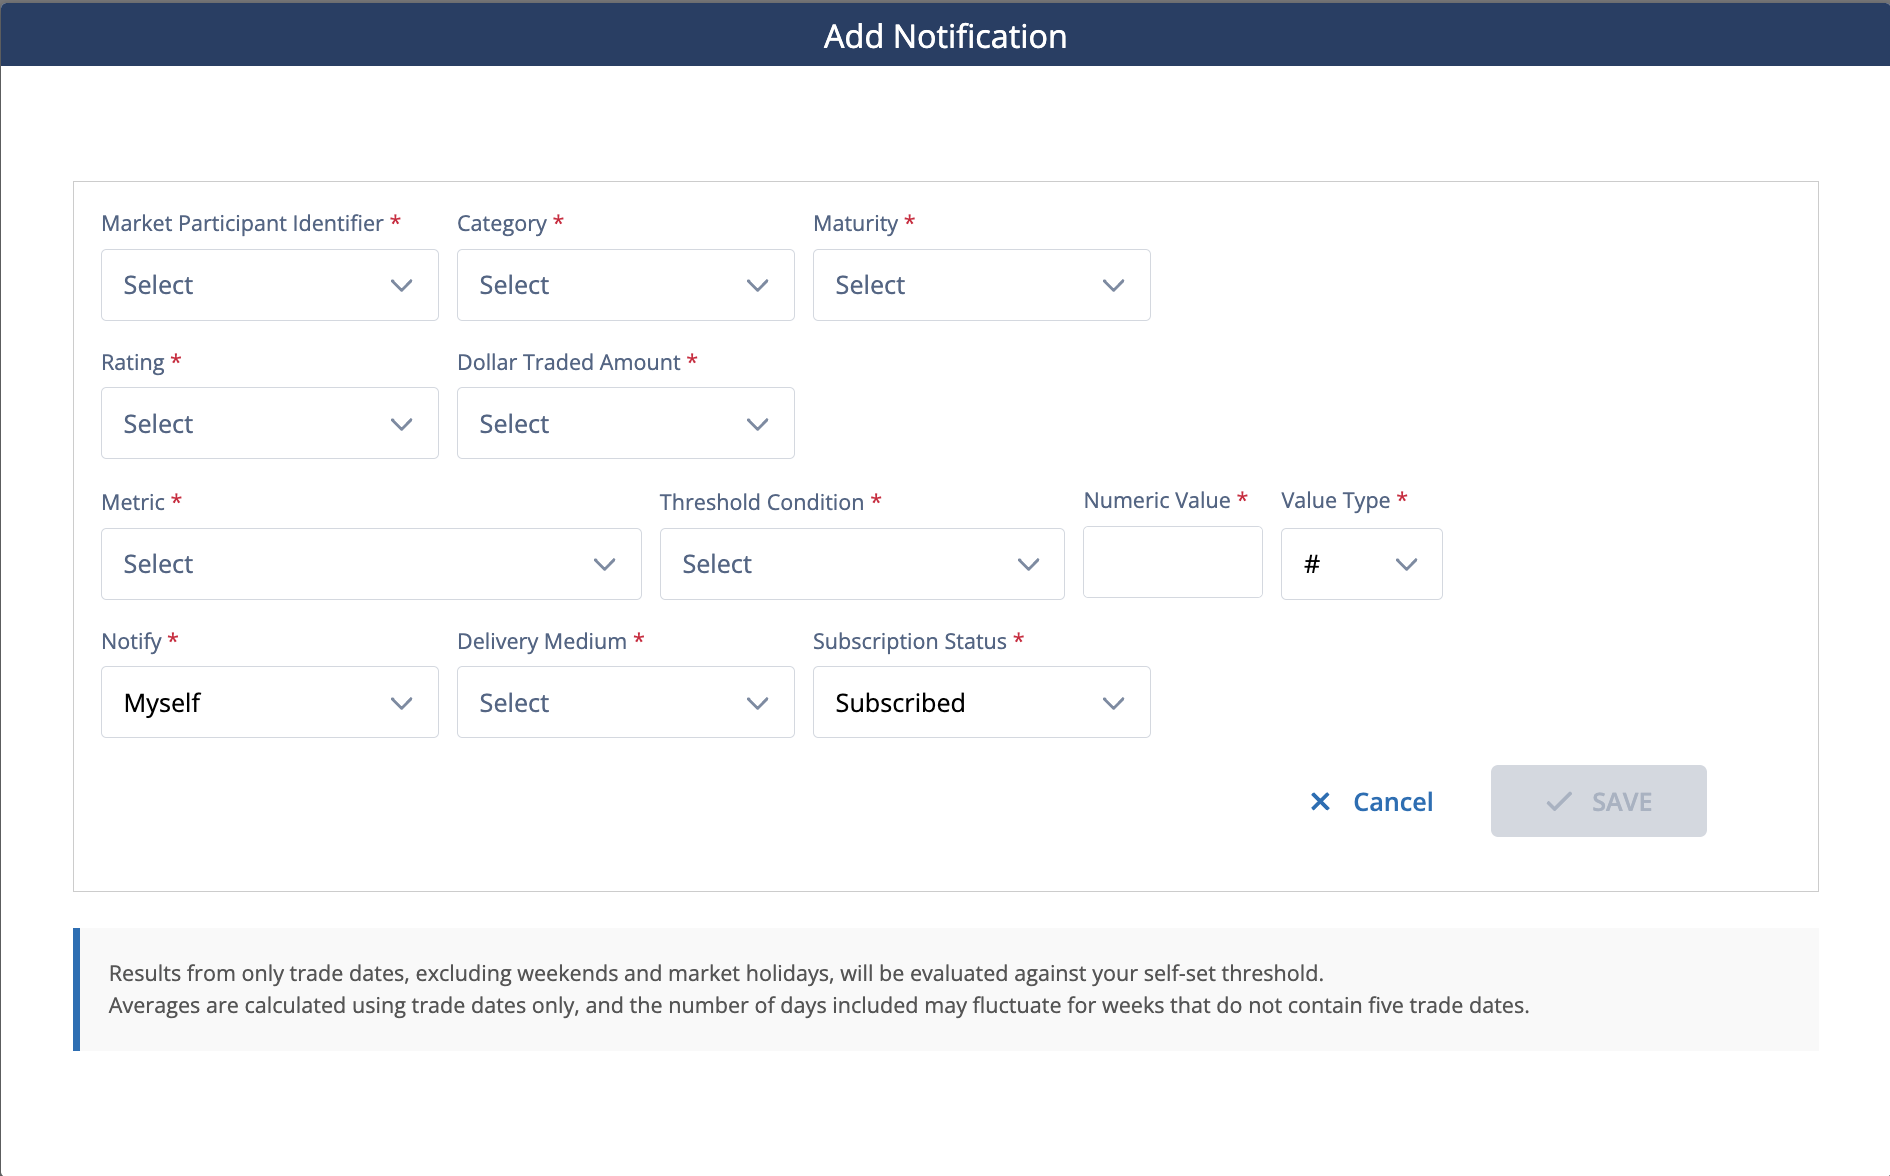
Once selected, a dialog box will appear that allows you to configure a set of parameters (a “Rule”) that will result in FINRA sending a notification if the conditions of the Rule are met. The top line of the dialog box prompts you to first select the firm Market Participant Identifier for which you would like to set a Rule.
After you have selected an MPID, configure the notification criterion. This includes the scope of the Rule (i.e., Category, Maturity, Rating, Dollar Traded Amount), the metric measured (i.e., Percent Profit, Dollar Profit), and the threshold against which the Rule will be evaluated (e.g., greater than 2%). See the below Self-Set Notification reference table for details regarding the configurable attributes.
Once you have finalized the notification criteria, you can configure who is notified when a Rule's criteria are met as well as the notification method. Additionally, you can enable or pause notifications using the Subscription Status drop-down. Specifically, the Notify field is auto populated with “myself,” but will include the ability to send to a group email if you have the appropriate permissions (see the next section for more details). The Delivery Medium field allows you to choose how you are notified: via email, via the Gateway notification feature (“Web”), or both. The Subscription Status defaults to “subscribed” and permits you to “unsubscribe” to previously set Rules, giving you the flexibility to pause a rule without deleting it and then resubscribe at a later date.
Once a Rule is saved, FINRA will evaluate the relevant Metric against your Threshold on the cadence you have set when the underlying data becomes available. When a relevant threshold is met or exceeded, FINRA will notify you using the Delivery Medium you selected. At any time, you can revisit an existing Rule on the Self-Set Notification page to manage existing Self-Set Notification Rules, create new Rules or unsubscribe from Rules. After you unsubscribe from or delete a Rule, FINRA will no longer evaluate a Metric for the Rule that you had created.
Setting up a Group Notification
Firms may designate certain users to create custom notifications for groups within their organization, including existing distribution lists or group inboxes. These group notifications operate identically to individual user notifications but reach multiple recipients simultaneously.
To set up a group notification, you must have the Interactive Reports Notification Distribution List entitlement. If you are a Super Account Administrator (“SAA”), you can enable this entitlement for yourself or assign it to a member of your firm. If you are not an SAA, reach out to your SAA to obtain this entitlement. Once you have the appropriate entitlement, you can create, change, or delete group notifications.
To create a group notification, complete the Rule setting component (i.e., Metric, Threshold Condition, Numeric Value, Value Type) as outlined above and then in the Notify dialog box select “Others.” Once you have selected Others, a dialog box will open called “Distribution Email.”
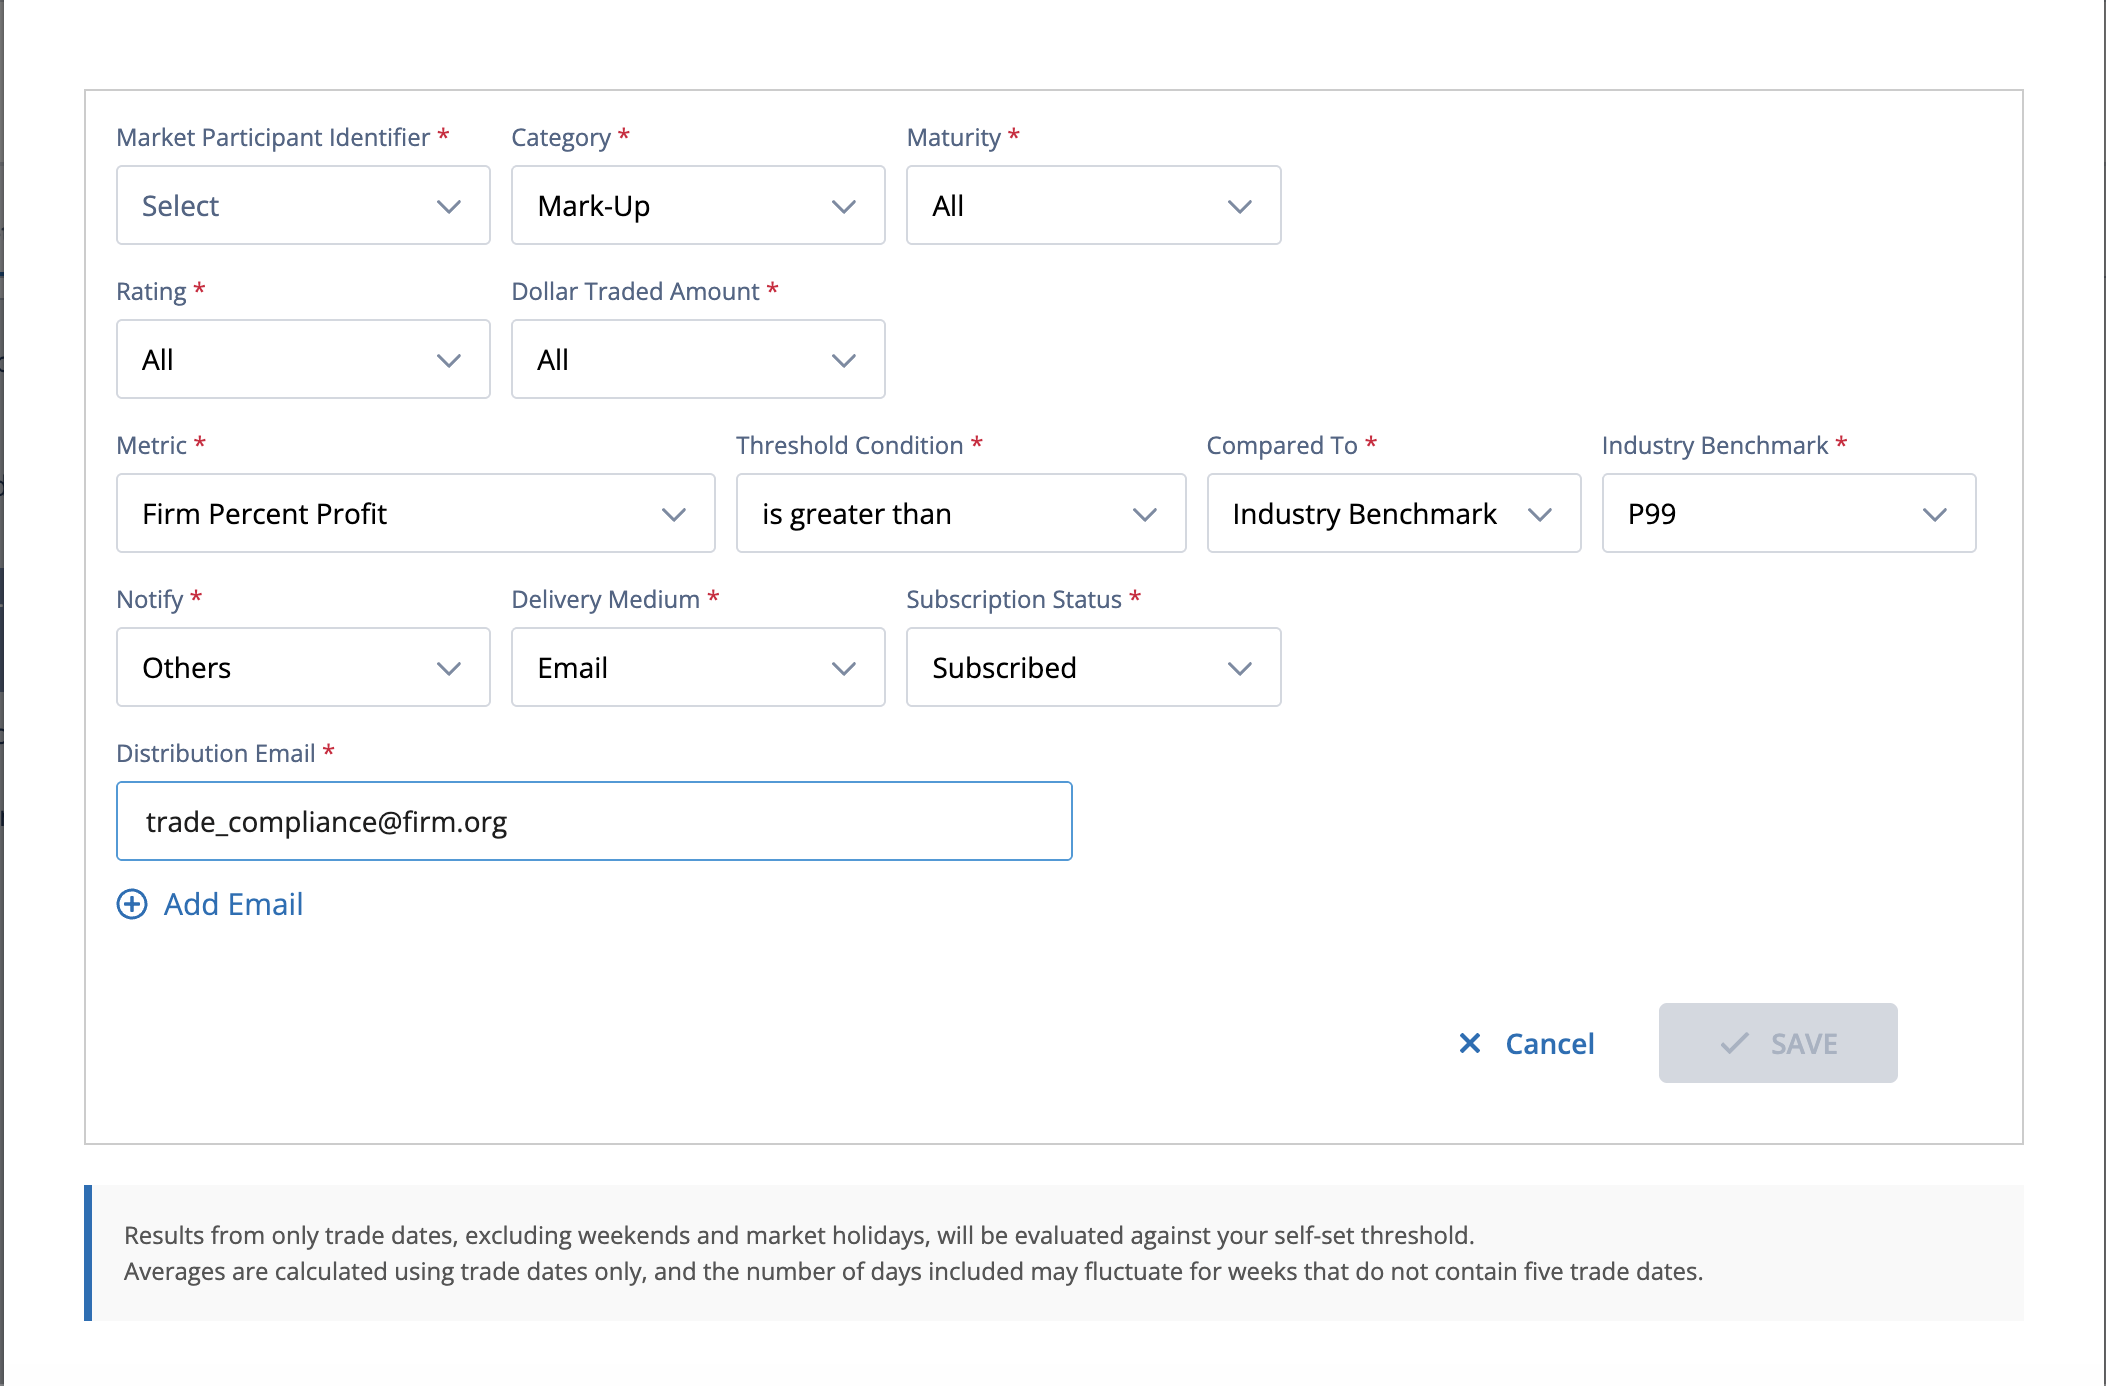
Enter your desired group email address (e.g., [email protected]) in the Distribution Email free text space. You may enter more than one email address. Once saved, when a relevant threshold is met or exceeded, FINRA will send notifications to this group's email address.
Users with Interactive Reports Notification Distribution List entitlement can edit or unsubscribe from existing group notifications through the Self-Set Notification navigation tab at the top of the MU/MD Indicators Dashboard.
Self-Set Notification Reference Table
| Attribute Name | Attribute Description |
|---|---|
| Market Participant Identifier | Select one MPID from the drop-down menu |
| Category |
|
| Maturity | Defined time period before the security reaches maturity |
| Rating | Investment Grade, Non-Investment Grade, or Unrated |
| Dollar Traded Amount | The total dollar value of the bonds traded in a pair. |
| Metric | Select Firm Percent Profit or Firm Dollar Profit |
| Threshold Condition | One option for Mark-Up/Mark-Down, “is greater than” |
| Compared To | Industry Benchmark or Custom Threshold
Note: Dollar Profit can only be compared to a Custom Threshold |
| Numeric Value | User Entered Value Number must be greater than zero. |
| Value Type | % or $
For Firm Percent Profit, will be set to %. For Firm Dollar Profit, will be set to $. |
| Notify |
* The Others option is only available to users who have the Interactive Reports Notification Distribution List entitlement granted by their firm's Super Account Administrator. This option allows designated users, inside a firm, to create or modify custom notifications to be sent to individuals inside their organization, other than themselves, or to shared inbox addresses who would not otherwise have a user account. |
| Delivery Medium | Web refers to being notified through the Gateway’s notifications, upon logging-in. Email is a notification sent to a designated email address. Web & Email delivers notifications through both methods listed above simultaneously. |
| Subscription Status | This selection designates if a Custom Notification is currently active or inactive. |
Export File Layouts
Manifest
| Attribute Name | Attribute Description |
|---|---|
| Begin Date | Extract begin date. |
| End Date | Extract end date. |
| MPID | Market Participant ID (MPID) of extract. |
| Firm CRD ID | The unique number associated with the broker-dealer member in FINRA’s Central Registration Depository (CRD) |
| Category | Mark-Up, Mark-Down, or Customer-to-Customer |
| Maturity | Defined time period before the security reaches maturity |
| Rating | Investment Grade, Non-Investment Grade, or Unrated |
| Dollar Traded | The total dollar value of the bonds traded in a pair. |
| Percent Threshold for Trade Visualizations Underlying Details (%) | Percent threshold used to filter the Trade Visualizations Underlying Details file. Pairs with a percent profit under this threshold will not be included. |
| Dollar Threshold for Trade Visualizations Underlying Details ($) | Dollar threshold used to filter the Trade Visualizations Underlying Details file. Pairs with a dollar profit under this threshold will not be included. |
| Trade Date for Trade Details | The selected trade date used to filter the Trade Details file. Only pairs for the selected date will be included in the file. |
| Percent Threshold for Trade Details (%) | Percent threshold used to filter the Trade Details file. Pairs with a percent profit under this threshold will not be included. |
| Dollar Threshold for Trade Details ($) | Dollar threshold used to filter the Trade Details file. Pairs with a dollar profit under this threshold will not be included. |
Industry Benchmark
| Attribute Name | Attribute Description |
|---|---|
| Date | Extract period (one month) |
| Category | Mark-Up, Mark-Down, or Customer-to-Customer |
| Maturity | Defined time period before the security reaches maturity |
| Rating | Investment Grade, Non-Investment Grade, or Unrated |
| Dollar Traded Amount | The total dollar value of the bonds traded in a pair.
Note: When a one-to-many pairing occurs, the dollar value of each customer trade is included individually. |
| Number of Trades Evaluated | A count of the number of customer trades evaluated based on the criteria utilized.
Note: When a one-to-many pairing occurs, this results in a count for each customer trade included in the pairing. |
| Firm: Mean | The average calculated Mark-Up or Mark-Down or Customer-to-Customer percentage for all of the pairs (sum of the Mark-Up/Mark-Down/Customer-to-Customer divided by the number of pairs). |
| Firm: Median | The middle value of the calculated Mark-Up or Mark-Down or Customer-to-Customer percentage for all of the pairs. |
| Industry: Mean | The average calculated Mark-Up or Mark-Down or Customer-to-Customer percentage for all of the pairs (sum of the Mark-Up/Mark-Down/Customer-to-Customer divided by the number of pairs). |
| Industry: Median | The middle value of the calculated Mark-Up or Mark-Down or Customer-to-Customer percentage for all of the pairs. |
| Industry: P25 | The calculated Mark-Up or Mark-Down or Customer-to-Customer percentage for the industry where 25% of all values for FINRA calculated pairs fall below the displayed value. |
| Industry: P50 | The calculated Mark-Up or Mark-Down or Customer-to-Customer percentage for the industry where 50% of all values for FINRA calculated pairs fall below the displayed value. |
| Industry: P75 | The calculated Mark-Up or Mark-Down or Customer-to-Customer percentage for the industry where 75% of all values for FINRA calculated pairs fall below the displayed value. |
| Industry: P80 | The calculated Mark-Up or Mark-Down or Customer-to-Customer percentage for the industry where 80% of all values for FINRA calculated pairs fall below the displayed value. |
| Industry: P90 | The calculated Mark-Up or Mark-Down or Customer-to-Customer percentage for the industry where 90% of all values for FINRA calculated pairs fall below the displayed value. |
| Industry: P95 | The calculated Mark-Up or Mark-Down or Customer-to-Customer percentage for the industry where 95% of all values for FINRA calculated pairs fall below the displayed value. |
| Industry: P99 | The calculated Mark-Up or Mark-Down or Customer-to-Customer percentage for the industry where 99% of all values for FINRA calculated pairs fall below the displayed value. |
Trade Visualizations Underlying Details
| Attribute Name | Attribute Description |
|---|---|
| Event ID | A FINRA created identifier to help uniquely identify the pairing in the monthly report. |
| Trade Date | The trade date of the transaction pair |
| Category | Mark-Up, Mark-Down, or Customer-to-Customer |
| Firm | The MPID of the firm whose trade pairs are being evaluated. |
| Trade Type | Single or multiple trade events |
| Calculated Percentage Profit | The percentage increase (or decrease) in the cost to buy the security and the proceeds from selling the security for the trade pair. |
| Calculated Dollar Profit | The difference between the cost to buy the security and the proceeds from selling the security for the trade pair. |
| Purchase Execution Date/Time | The trade date/time of the purchase leg of the transaction in the pair. Depending on the type of pair (Mark-Up, Mark-Down, or Customer-to-Customer) this may be a purchase from a customer or from a broker-dealer. |
| Sale Execution Date/Time | The trade date/time of the sale leg of the transaction in the pair. Depending on the type of pair (Mark-Up, Mark-Down, or Customer-to-Customer) this may be a sale to a customer or to a broker-dealer. |
| Security ID | The industry identifier for the security involved in the subject pair. |
| SnP Ratings | Credit rating, ranging from AAA to D |
| Issue Maturity Date | The date on which the principal amount of the security becomes due. Note: Perpetual bonds are identified with maturity dates of 12/31/3999. |
| Bought From | The contra party for the leg of the transaction where the subject firm has purchased the subject security in the pair identified by FINRA. |
| Sold To | The contra party for the leg of the transaction where the subject firm has sold the subject security in the pair identified by FINRA. |
| Bought Volume | The number of bonds in the purchase leg of the transaction in the pair. Note: some pairs identified by FINRA may not have identical volume for both the bought and sold volume. |
| Sold Volume | The number of bonds in the sale leg of the transaction in the pair. Note: some pairs identified by FINRA may not have identical volume for both the bought and sold volume. |
| Purchase Price | The reported price for the trade for the purchase leg of the transaction in the pair. |
| Sale Price | The reported price for the trade for the sale leg of the transaction in the pair. |
Trade Details
| Attribute Name | Attribute Description |
|---|---|
| Event ID | A FINRA created identifier to help uniquely identify the pairing in the monthly report. |
| Trade Date | The trade date of the transaction pair |
| Category | Mark-Up, Mark-Down, or Customer-to-Customer |
| Firm | The MPID of the firm whose trade pairs are being evaluated. |
| Trade Type | Single or multiple trade events |
| Calculated Percentage Profit | The percentage increase (or decrease) in the cost to buy the security and the proceeds from selling the security for the trade pair. |
| Calculated Dollar Profit | The difference between the cost to buy the security and the proceeds from selling the security for the trade pair. |
| Purchase Execution Date/Time | The trade date/time of the purchase leg of the transaction in the pair. Depending on the type of pair (Mark-Up, Mark-Down, or Customer-to-Customer) this may be a purchase from a customer or from a broker-dealer. |
| Sale Execution Date/Time | The trade date/time of the sale leg of the transaction in the pair. Depending on the type of pair (Mark-Up, Mark-Down, or Customer-to-Customer) this may be a sale to a customer or to a broker-dealer. |
| Security ID | The industry identifier for the security involved in the subject pair. |
| SnP Ratings | Credit rating, ranging from AAA to D |
| Issue Maturity Date | The date on which the principal amount of the security becomes due. Note: Perpetual bonds are identified with maturity dates of 12/31/3999. |
| Bought From | The contra party for the leg of the transaction where the subject firm has purchased the subject security in the pair identified by FINRA. |
| Sold To | The contra party for the leg of the transaction where the subject firm has sold the subject security in the pair identified by FINRA. |
| Bought Volume | The number of bonds in the purchase leg of the transaction in the pair. Note: some pairs identified by FINRA may not have identical volume for both the bought and sold volume. |
| Sold Volume | The number of bonds in the sale leg of the transaction in the pair. Note: some pairs identified by FINRA may not have identical volume for both the bought and sold volume. |
| Purchase Price | The reported price for the trade for the purchase leg of the transaction in the pair. |
| Sale Price | The reported price for the trade for the sale leg of the transaction in the pair. |