Representative Data
Table of Contents
1.1 Sizes and Counts- Figure 1.1.2 FINRA-Registered Representatives by Firm Size, 2018-2022
- Table 1.1.3 FINRA-Registered Representatives by Firm Size, 2018–2022
- Figure 1.1.4 Average and Median Number of FINRA-Registered Representatives per Firm, 2018-2022
- Table 1.1.5 Average and Median Number of FINRA-Registered Representatives per Firm, 2018-2022
- Figure 1.1.6 Registered Individuals by Type of Registration, 2022
- Table 1.1.7 Securities Industry Registered Individuals by Type of Registration, 2022
- Figure 1.1.8 Securities Industry Registered Individuals by Type of Registration, 2013-2022
1.2 Status Changes- Figure 1.2.1 FINRA-Registered Representatives – Leaving/Entering the Industry, 2018-2022
- Table 1.2.2 FINRA-Registered Representatives – Leaving/Entering the Industry, 2018-2022
- Figure 1.2.3 Firm Size Distribution of FINRA-Registered Representatives Leaving/Entering the Industry, 2018-2022
- Figure 1.2.4 Securities Industry Registered Individuals’ Transfers Between Firms within the Industry, 2018-2022
- Figure 1.2.5 Securities Industry Registered Individuals’ Transfers Between Firms by Registration Type, 2016-2021
1.3 Geographic Distribution- Figure 1.3.1 Geographic Distributions of State Level Registrations, 2022
- Table 1.3.2 Geographic Distributions of Region Level Registrations, 2018−2022
1.1 Sizes and Counts
Anyone actively involved in a FINRA-registered firm’s investment banking or securities business must be registered as a representative with FINRA (FINRA-registered representative). To become registered, securities professionals are required to pass qualification exams to demonstrate competence in their particular securities activities. A FINRA-registered representative’s duties may include supervision, sales of securities or training of persons associated with the member firm.
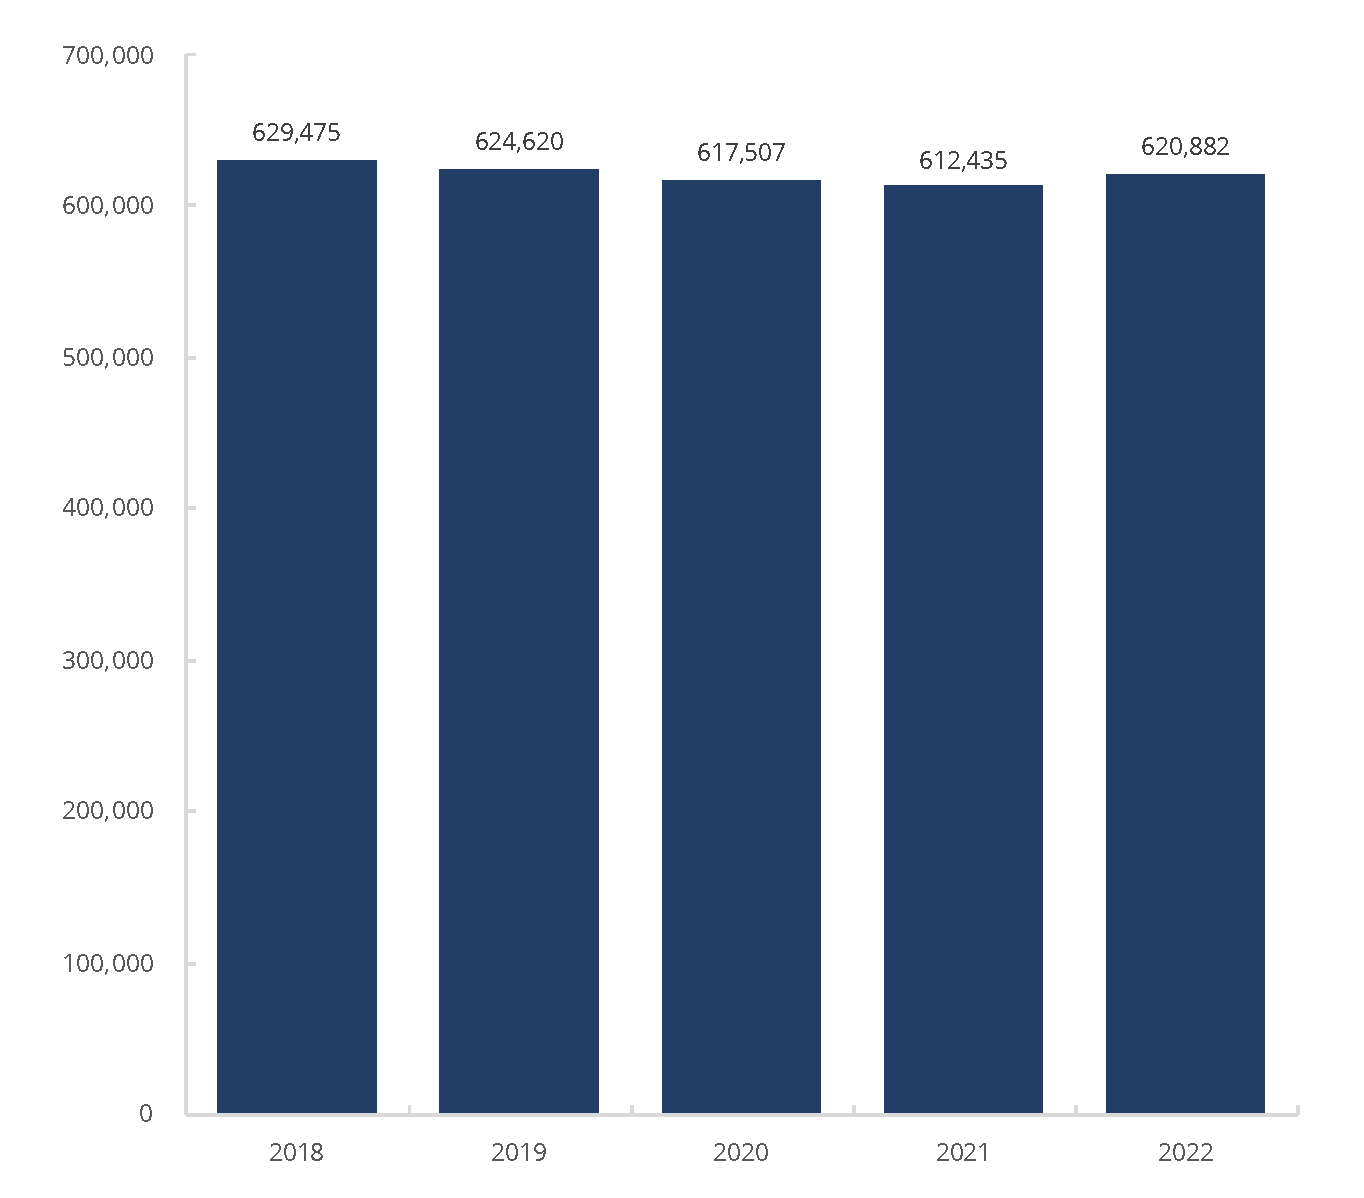
Figure 1.1.1 Total Number of FINRA-Registered Representatives, 2018–2022
(Count as of year-end)
Source: Financial Industry Regulatory Authority.
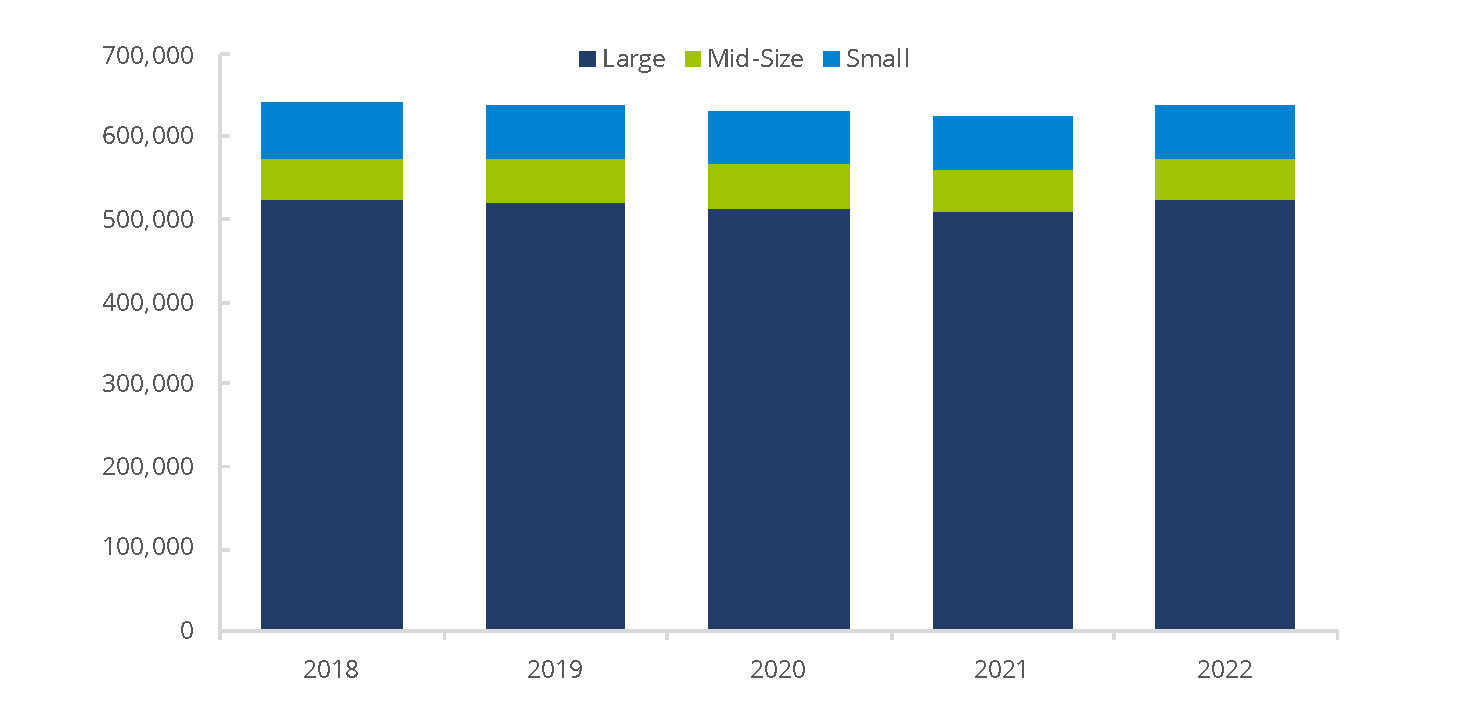
Figure 1.1.2 FINRA-Registered Representatives by Firm Size, 2018–20221
(Count as of year-end)
Source: Financial Industry Regulatory Authority.
1 Registrations by firm size differ from the total number of registrations as individuals registered with multiple firms are counted for each firm they represent, potentially in the same size class or in multiple size classes depending on the sizes of the employing firms. Large firm = 500 or more registered representatives; Mid-Size firm = 151-499 registered representatives; Small firm = 1-150 registered representatives.
Table 1.1.3 FINRA-Registered Representatives by Firm Size, 2018–20221
(Count as of year-end)
| 2018 | 2019 | 2020 | 2021 | 2022 | ||||||
| Firm Size | Total | Percent | Total | Percent | Total | Percent | Total | Percent | Total | Percent |
| Large | 522,901 | 81.5% | 519,687 | 81.5% | 513,900 | 81.5% | 510,170 | 81.5% | 524,075 | 82.3% |
| Mid-Size | 52,448 | 8.2% | 53,762 | 8.4% | 52,484 | 8.3% | 51,007 | 8.1% | 50,886 | 8.0% |
| Small | 66,048 | 10.3% | 64,166 | 10.1% | 64,099 | 10.2% | 64,864 | 10.4% | 62,076 | 9.7% |
| Total | 641,397 | 100% | 637,615 | 100% | 630,483 | 100% | 626,041 | 100% | 637,037 | 100% |
Source: Financial Industry Regulatory Authority.
1 Registrations by firm size differ from the total number of registrations as individuals registered with multiple firms are counted for each firm they represent, potentially in the same size class or in multiple size classes depending on the sizes of the employing firms. Large firm = 500 or more registered representatives; Mid-Size firm = 151-499 registered representatives; Small firm = 1-150 registered representatives.
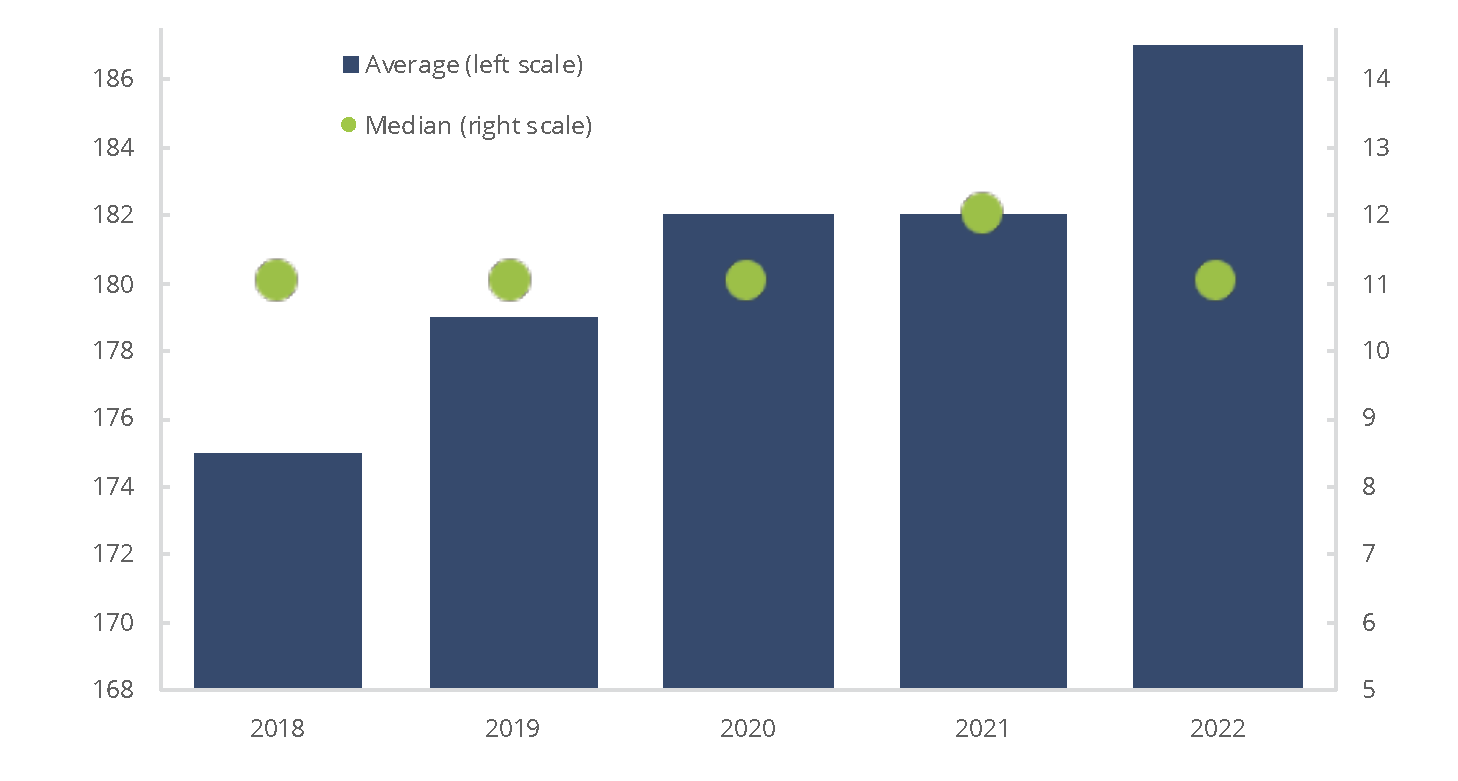
Figure 1.1.4 Average and Median Number of FINRA-Registered Representatives per Firm, 2018–2022
(Count as of year-end)
Source: Financial Industry Regulatory Authority.
Table 1.1.5 Average and Median Number of FINRA-Registered Representatives per Firm, 2018–2022
(Count as of year-end)
| 2018 | 2019 | 2020 | 2021 | 2022 | |
| Average | 175 | 179 | 182 | 182 | 187 |
| Median | 11 | 11 | 11 | 12 | 11 |
Source: Financial Industry Regulatory Authority.
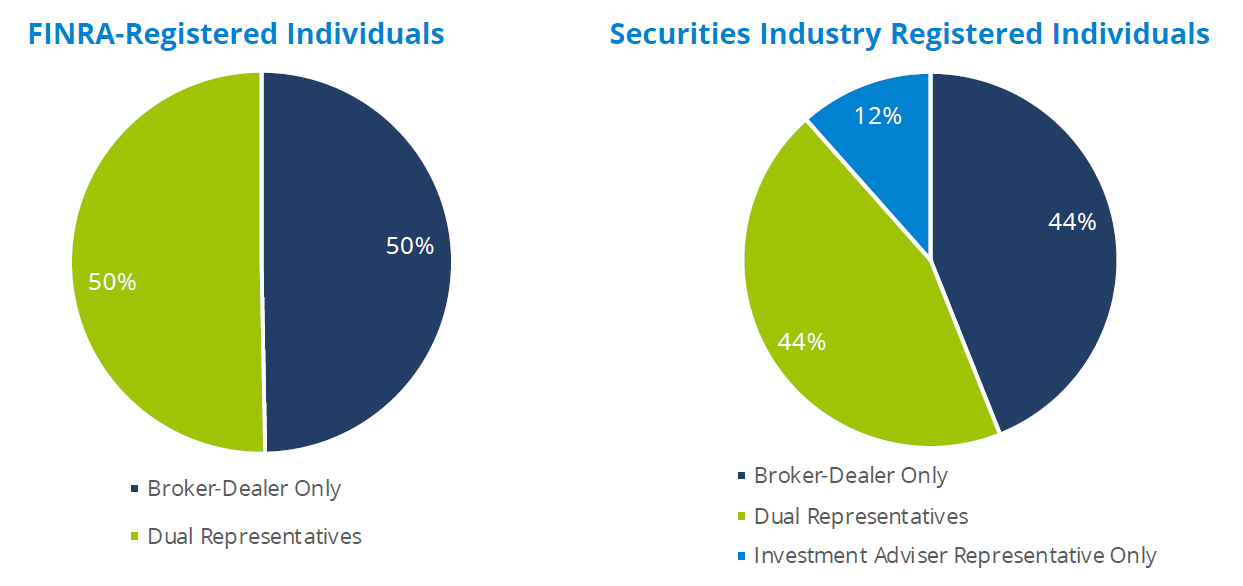
Figure 1.1.6 Registered Individuals by Type of Registration, 20221,2
Source: Financial Industry Regulatory Authority.
1 Owners of investment advisory firms may be exempt from registering as Investment Adviser Representatives. Accordingly, these Investment Adviser Representatives are not included in the table.
2 "Broker Dealer Representatives Only" refers to FINRA-registered representatives. "Dual Representatives" refers to FINRA-registered representatives who are also registered as investment adviser representatives. "Investment Adviser Representatives Only" refers to individuals who are registered only as investment adviser representatives and are overseen by the SEC or state regulators. “Securities Industry Registered Persons” represents the totality of registered individuals. Individuals are counted only once regardless of how many firms they represent. FINRA captures requirements on all Securities Registered Persons, including those that are not “FINRA-registered representatives”
Table 1.1.7 Securities Industry Registered Individuals by Type of Registration, 20221,2
(Count as of year-end)
| Total Number of Individuals | |
| Broker-Dealer—Only | 308,565 |
| Dual Broker-Dealer Investment Adviser Representative | 312,317 |
| All BD Registered Individuals | 620,882 |
| Investment Adviser Representative—Only | 80,977 |
| Total Registered Individuals | 701,859 |
Source: Financial Industry Regulatory Authority.
1 Owners of investment advisory firms may be exempt from registering as Investment Adviser Representatives. Accordingly, these Investment Adviser Representatives are not included in the table.
2 "Broker Dealer Representatives Only" refers to FINRA-registered representatives. "Dual Representatives" refers to FINRA-registered representatives who are also registered as investment adviser representatives. "Investment Adviser Representatives Only" refers to individuals who are registered only as investment adviser representatives and are overseen by the SEC or state regulators. “Securities Industry Registered Persons” represents the totality of registered individuals. Individuals are counted only once regardless of how many firms they represent. FINRA captures requirements on all Securities Registered Persons, including those that are not “FINRA-registered representatives”
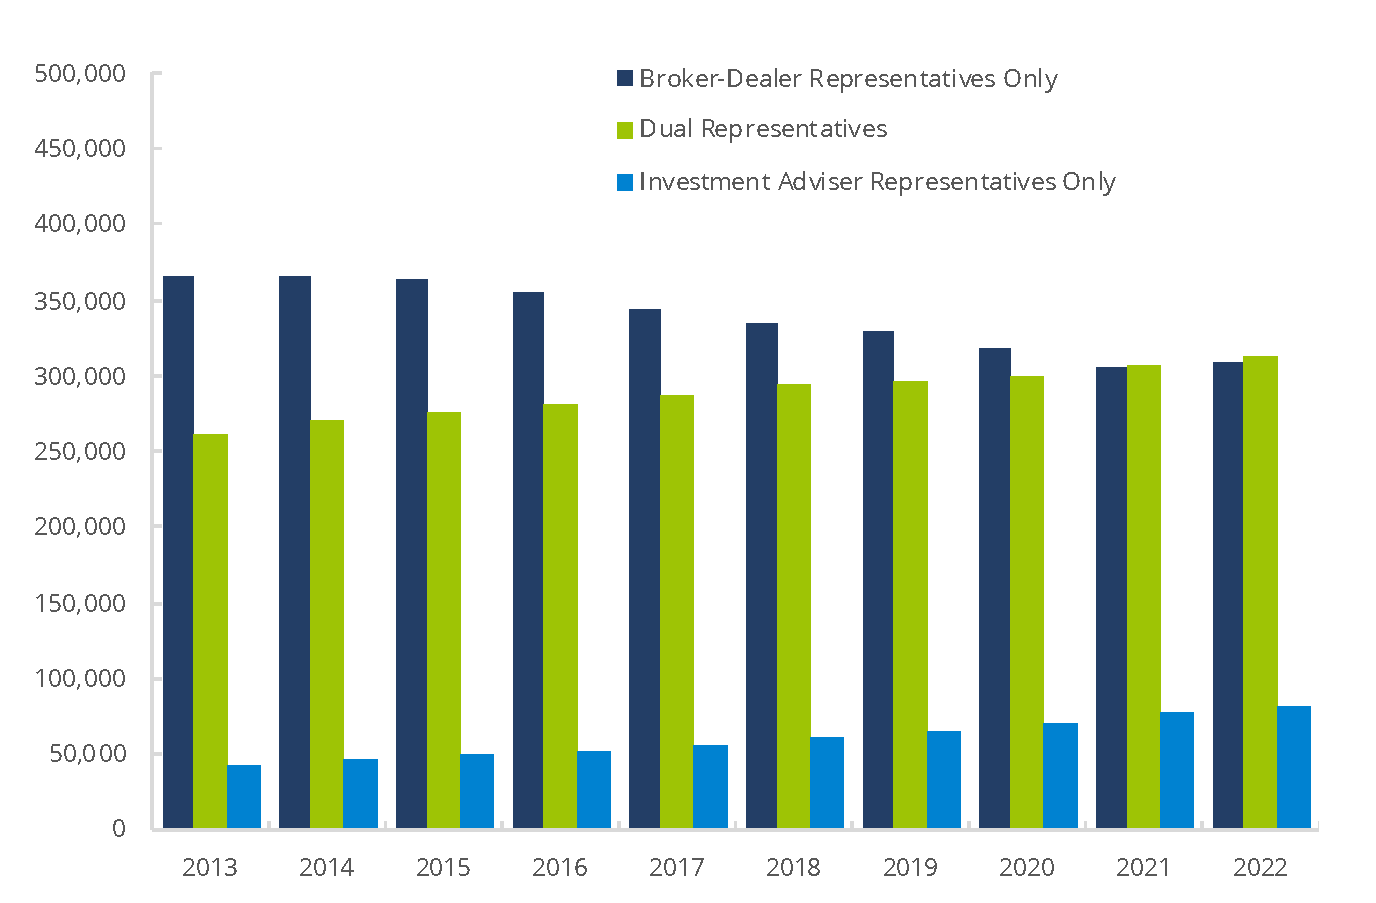
Figure 1.1.8 Securities Industry Registered Individuals by Type of Registration, 2013–20221,2
(Count as of year-end)
Source: Financial Industry Regulatory Authority.
1 Investment adviser representatives who solely deal with customers in New York prior to February 1, 2021, or who were solely dealing with customers in Wyoming prior to July 1, 2017, are not captured in the Central Registration Depository (CRD) system. Furthermore, owners of investment advisory firms may be exempt from registering as Investment Adviser Representatives. Accordingly, these Investment Adviser Representatives are not included in the table.
2 "Broker Dealer Representatives Only" refers to FINRA-registered representatives. "Dual Representatives" refers to FINRA-registered representatives who are also registered as investment adviser representatives. "Investment Adviser Representatives Only" refers to individuals who are registered only as investment adviser representatives and are overseen by the SEC or state regulators. “Securities Industry Registered Persons” represents the totality of registered individuals. Individuals are counted only once regardless of how many firms they represent. FINRA captures requirements on all Securities Registered Persons, including those that are not “FINRA-registered representatives”
1.2 Status Changes
Figure 1.2.1 FINRA-Registered Representatives – Leaving/Entering the Industry, 2008–2022
(Count as of year-end)
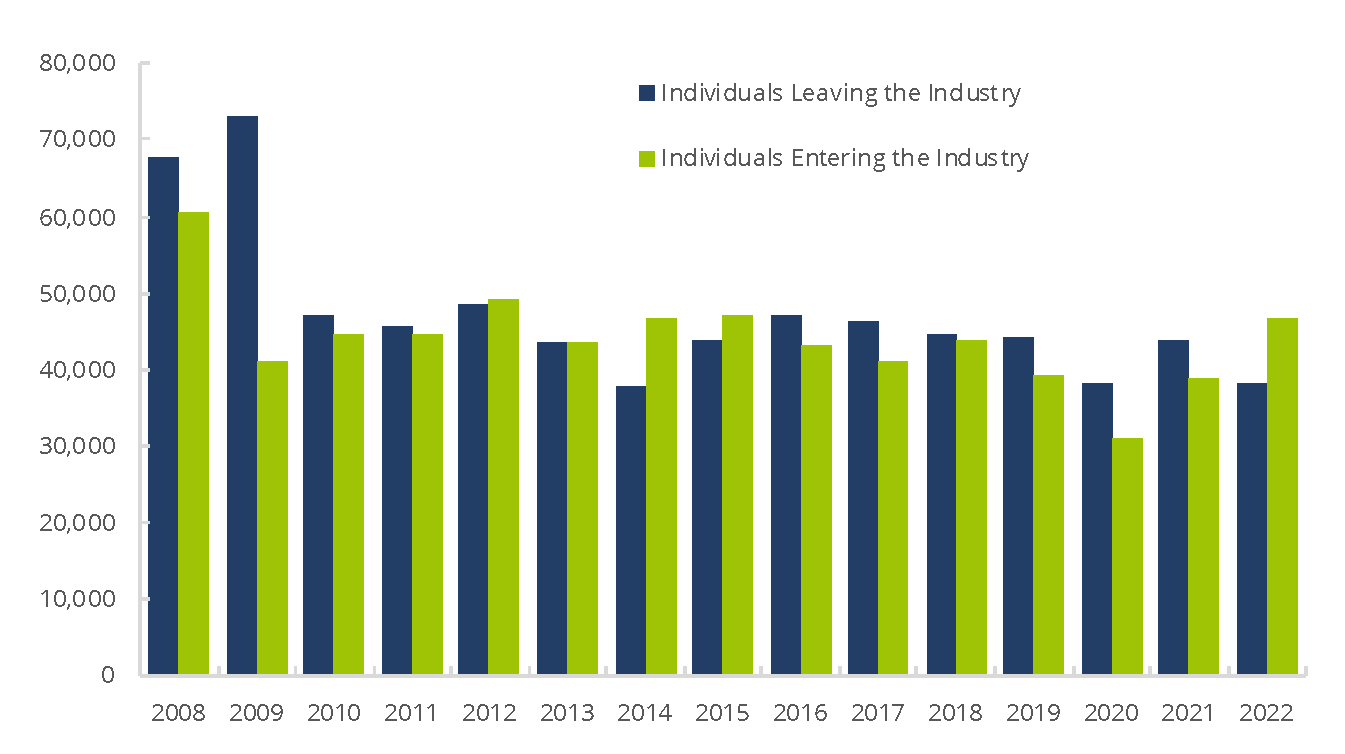
Source: Financial Industry Regulatory Authority.
Table 1.2.2 FINRA-Registered Representatives – Leaving/Entering the Industry, 2008–2022
(Count as of year-end)
| Year | Individuals Leaving | Percent of Total | Individuals Entering | Percent of Total | End of Year Total Registered Representatives |
| 2008 | 67,611 | 10% | 60,715 | 9% | 662,893 |
| 2009 | 72,864 | 12% | 40,869 | 6% | 630,899 |
| 2010 | 47,091 | 7% | 44,649 | 7% | 628,457 |
| 2011 | 45,780 | 7% | 44,381 | 7% | 627,058 |
| 2012 | 48,590 | 8% | 49,009 | 8% | 627,477 |
| 2013 | 43,646 | 7% | 43,643 | 7% | 627,474 |
| 2014 | 37,918 | 6% | 46,603 | 7% | 636,159 |
| 2015 | 43,776 | 7% | 47,035 | 7% | 639,418 |
| 2016 | 47,041 | 7% | 43,221 | 7% | 635,598 |
| 2017 | 46,284 | 7% | 40,901 | 6% | 630,215 |
| 2018 | 44,550 | 7% | 43,810 | 7% | 629,475 |
| 2019 | 44,101 | 7% | 39,246 | 6% | 624,620 |
| 2020 | 38,144 | 6% | 31,031 | 5% | 617,507 |
| 2021 | 43,893 | 7% | 38,821 | 6% | 612,435 |
| 2022 | 38,236 | 6% | 46,683 | 8% | 620,882 |
Source: Financial Industry Regulatory Authority.
1 The End-of-Year Total Registered Representatives for the years 2008-2012 have been updated to correct an error. The error was corrected on August 23, 2023.
Figure 1.2.3 Firm Size Distribution of FINRA-Registered Representatives Leaving/Entering the Industry, 2008–20221
(Percentage of Total)
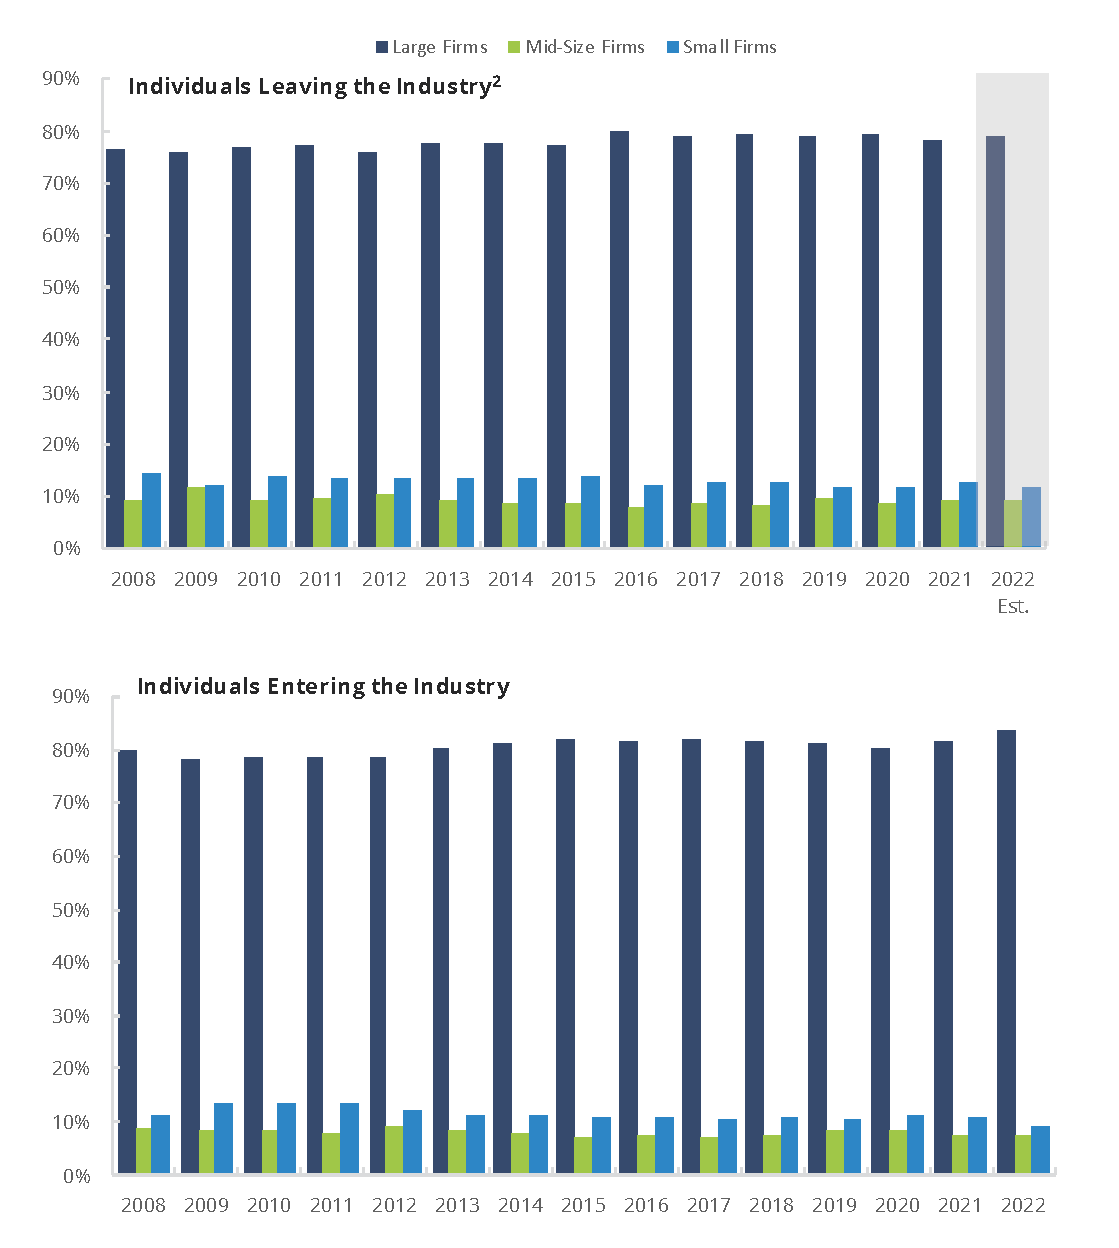
Source: Financial Industry Regulatory Authority.
1 Individuals leaving and entering by firm size may differ from the total number of individuals leaving and entering the industry as individuals registered with multiple firms are counted for each firm they represent, potentially in the same size class or in multiple size classes depending on the sizes of the employing firms. Large Firm = 500 or more registered representatives; Mid-Size Firm = 151-499 registered representatives; Small Firm = 1-150 registered representatives.
2 An individual is considered to have left the industry when the individual has no open registration with any FINRA-registered firm from the date of their last registration through the end of the next calendar year. Values for 2022 are estimates given that data through December 2023 is required to compute individuals leaving the industry.
Figure 1.2.4 Securities Industry Registered Individuals’ Transfers Between Firms within the Industry, 2017–20221
(Count as of year-end)
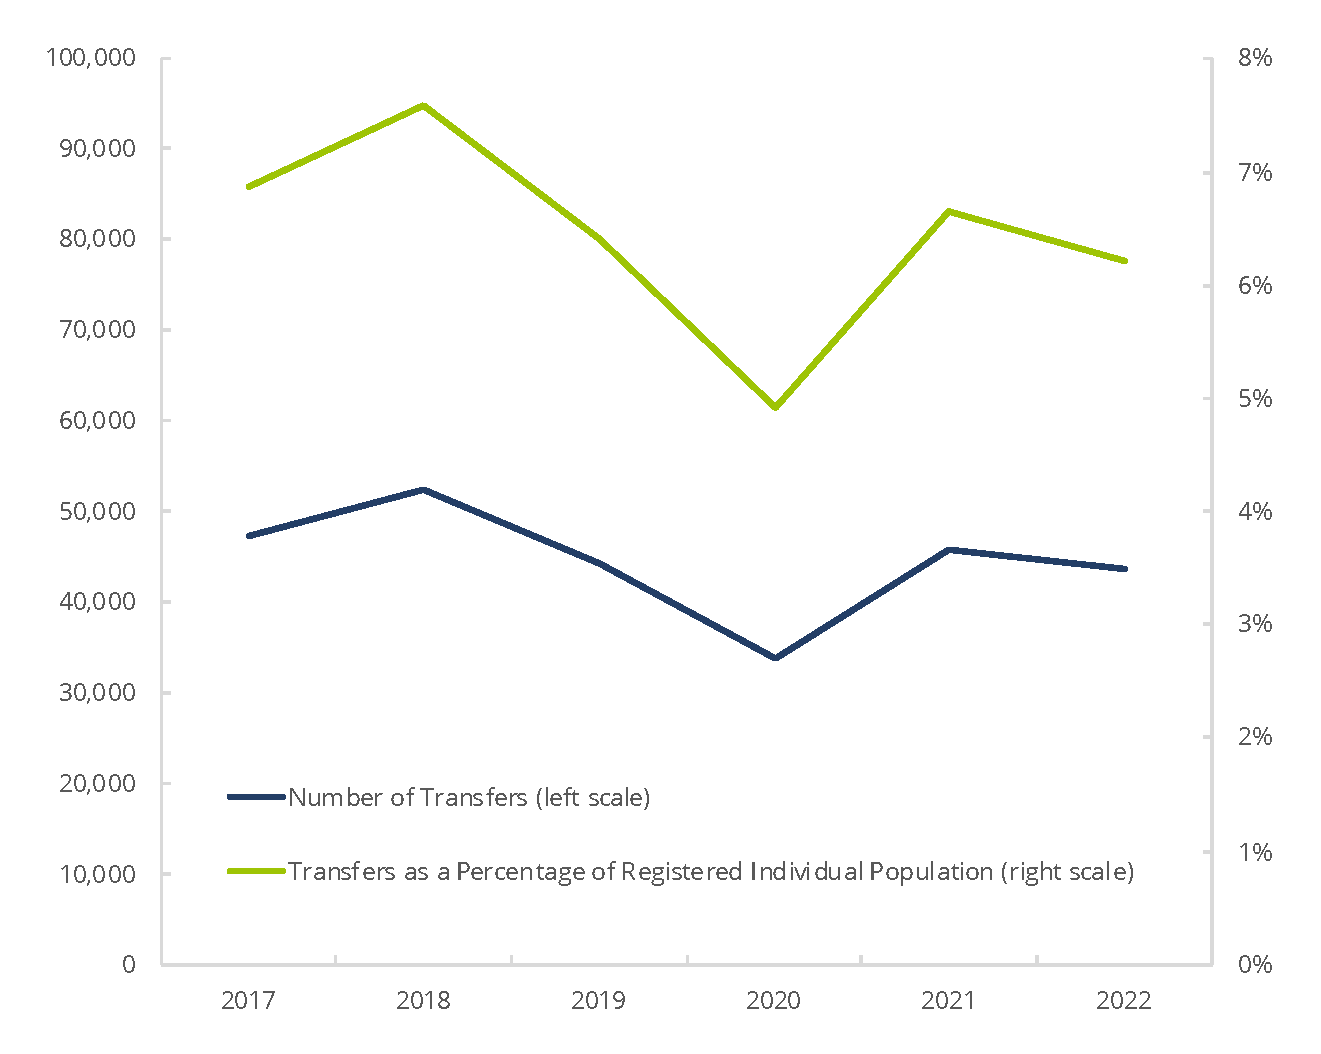
Source: Financial Industry Regulatory Authority.
1 The number of transfers in a given year includes all transfers associated with Securities Industry Registered Individuals who dropped a registration with a firm and added a registration with another firm, irrespective of the individual's registration type, within 60 days before or 60 days after dropping the registration. These individuals represent a subset of all individuals changing jobs within the industry.
Figure 1.2.5 Securities Industry Registered Individuals’ Transfers Between Firms by Registration Type, 2017–20221,2
(Count as of year-end)
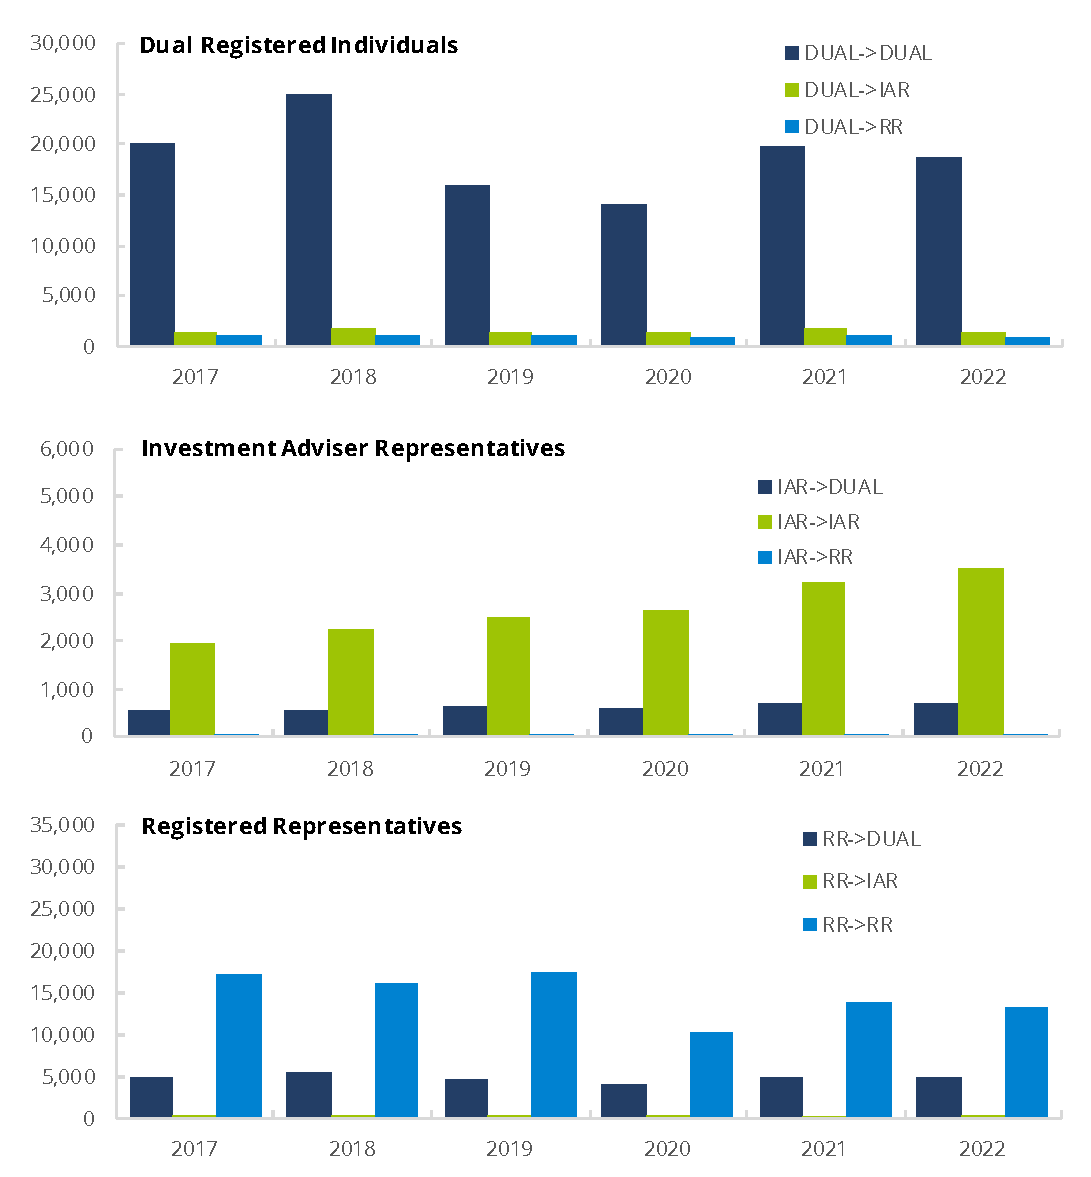
Source: Financial Industry Regulatory Authority.
1 Investment adviser representatives who solely deal with customers in New York prior to February 1, 2021, or who were solely dealing with customers in Wyoming prior to July 1, 2017, are not captured in the Central Registration Depository (CRD) system. Furthermore, owners of investment advisory firms may be exempt from registering as Investment Adviser Representatives. Accordingly, these Investment Adviser Representatives are not included in the table.
2 The number of transfers in a given year includes all transfers associated with Securities Industry Registered Individuals who dropped a registration with a firm and added a registration with a different firm within 60 days before or 60 days after dropping the registration. These transfers between firms include transfers from one registration type to another registration type (e.g. investment adviser registration at previous firm to registered representative registration at the new firm, "IAR -> RR"), as well as transfers for the same registration type (e.g. investment adviser registration at previous firm to same registration at the new firm, "IAR -> IAR").