Special Topics
Table of Contents
4.1 CAT Events- Table 4.1.1 Order Events Reported to the Consolidated Audit Trail (CAT) and Surveilled by FINRA SRO – Monthly Total Events1
- Table 4.1.2 Order Events Reported to the Consolidated Audit Trail (CAT) and Surveilled by FINRA SRO – Daily Average Events1
4.2 Options Activity- Figure 4.2.1 Options Trading Activity By Originating Account Owner Type, 2022
- Figure 4.2.2 Put/Call Ratio by Volume and Transaction Count, 2022
4.3 Demographic Changes- Figure 4.3.1 Age Distribution of U.S. Population and FINRA-Registered Representatives, 2010 & 2020
- Figure 4.3.2 Age Distribution of FINRA-Registered Representives By Year and Firm Size
4.4 Supplementary Liquidity Schedule- Figure 4.4.1 Providers of the Supplementary Liquidity Schedule – Type and Size, 2022
- Figure 4.4.2 Collateral Types Used by Providers of the Supplementary Liquidity Schedule, 2022
4.5 National Financial Capability Study- Figure 4.5.1 Taxable Investment Account Ownership By Year
- Figure 4.5.2 Taxable Investment Account Ownership By Year and Generation
- Figure 4.5.3 Taxable Investment Account Ownership By Year, Race and Ethnicity
4.1 CAT Events
Table 4.1.1 Order Events Reported to the Consolidated Audit Trail (CAT) and Surveilled by FINRA SRO – Monthly Total Events1
(January 3, 2022 − December 30, 2022; Millions of Events)
| Exchange | Industry Member | |||||||||||
| Month | Order | Modify | Route | Executions | Cancellations | Total | Order | Modify | Route | Executions | Cancellations | Total |
| January | 129,782 | 48,237 | 4,517 | 3,006 | 126,588 | 312,130 | 241,576 | 22,032 | 352,639 | 1,445 | 219,236 | 836,928 |
| February | 132,573 | 46,287 | 4,326 | 2,815 | 125,257 | 311,258 | 236,997 | 20,833 | 370,249 | 1,304 | 216,501 | 845,884 |
| March | 156,025 | 54,734 | 4,844 | 3,563 | 148,578 | 367,744 | 278,626 | 24,884 | 438,394 | 1,649 | 253,224 | 996,777 |
| April | 140,376 | 46,974 | 3,934 | 2,758 | 133,678 | 327,721 | 248,399 | 18,567 | 389,070 | 1,311 | 228,672 | 886,020 |
| May | 177,562 | 67,418 | 4,643 | 3,347 | 169,283 | 422,253 | 313,480 | 28,675 | 498,264 | 1,459 | 289,616 | 1,131,494 |
| June | 152,302 | 54,987 | 4,445 | 2,951 | 145,354 | 360,039 | 273,945 | 22,277 | 431,467 | 1,361 | 252,840 | 981,889 |
| July | 137,197 | 45,514 | 5,882 | 2,341 | 128,060 | 318,994 | 238,598 | 17,566 | 373,229 | 1,149 | 218,158 | 848,700 |
| August | 149,240 | 52,207 | 6,078 | 2,676 | 135,478 | 345,679 | 248,738 | 18,229 | 382,148 | 1,411 | 224,159 | 874,685 |
| September | 175,171 | 68,326 | 5,947 | 2,719 | 159,236 | 411,399 | 297,744 | 19,761 | 457,049 | 1,299 | 271,786 | 1,047,640 |
| October | 171,430 | 67,418 | 5,998 | 2,675 | 155,897 | 403,418 | 286,161 | 18,947 | 440,329 | 1,274 | 257,354 | 1,004,065 |
| November | 150,231 | 54,953 | 5,236 | 2,613 | 134,688 | 347,721 | 247,735 | 14,951 | 379,324 | 1,334 | 220,765 | 864,109 |
| December | 146,726 | 54,342 | 4,709 | 2,406 | 134,217 | 342,400 | 242,171 | 14,588 | 372,035 | 1,281 | 214,582 | 844,657 |
Source: Financial Industry Regulatory Authority. Data as of February 2023.
1 These figures are based on event data reported to CAT. The Exchange table reflects order events reported by Exchanges to CAT via the Plan Participant Specification and the Industry Member table reflects order events reported by Industry Members to CAT via the Industry Member Specification. Quotation activity is not included here except in instances where listed options quotations result in trade activity. During 2022, additional event types became reportable and are reflected here.
Table 4.1.2 Order Events Reported to the Consolidated Audit Trail (CAT) and Surveilled by FINRA SRO – Daily Average Events1
(January 3, 2022 − December 30, 2022; Millions of Events)
| Exchange | Industry Member | ||||||||||||
| Month | Number of Business Days | Order | Modify | Route | Executions | Cancellations | Total | Order | Modify | Route | Executions | Cancellations | Total |
| January | 20 | 6,489 | 2,412 | 226 | 150 | 6,329 | 15,607 | 12,079 | 1,102 | 17,632 | 72 | 10,962 | 41,846 |
| February | 19 | 6,978 | 2,436 | 228 | 148 | 6,592 | 16,382 | 12,474 | 1,096 | 19,487 | 69 | 11,395 | 44,520 |
| March | 23 | 6,784 | 2,380 | 211 | 155 | 6,460 | 15,989 | 12,114 | 1,082 | 19,061 | 72 | 11,010 | 43,338 |
| April | 20 | 7,019 | 2,349 | 197 | 138 | 6,684 | 16,386 | 12,420 | 928 | 19,454 | 66 | 11,434 | 44,301 |
| May | 21 | 8,455 | 3,210 | 221 | 159 | 8,061 | 20,107 | 14,928 | 1,365 | 23,727 | 69 | 13,791 | 53,881 |
| June | 21 | 7,252 | 2,618 | 212 | 141 | 6,922 | 17,145 | 13,045 | 1,061 | 20,546 | 65 | 12,040 | 46,757 |
| July | 20 | 6,860 | 2,276 | 294 | 117 | 6,403 | 15,950 | 11,930 | 878 | 18,661 | 57 | 10,908 | 42,435 |
| August | 23 | 6,489 | 2,270 | 264 | 116 | 5,890 | 15,030 | 10,815 | 793 | 16,615 | 61 | 9,746 | 38,030 |
| September | 21 | 8,341 | 3,254 | 283 | 129 | 7,583 | 19,590 | 14,178 | 941 | 21,764 | 62 | 12,942 | 49,888 |
| October | 21 | 8,163 | 3,210 | 286 | 127 | 7,424 | 19,210 | 13,627 | 902 | 20,968 | 61 | 12,255 | 47,813 |
| November | 21 | 7,154 | 2,617 | 249 | 124 | 6,414 | 16,558 | 11,797 | 712 | 18,063 | 64 | 10,513 | 41,148 |
| December | 21 | 6,987 | 2,588 | 224 | 115 | 6,391 | 16,305 | 11,532 | 695 | 17,716 | 61 | 10,218 | 40,222 |
Source: Financial Industry Regulatory Authority. Data as of February 2023.
1 These figures are based on event data reported to CAT. The Exchange table reflects order events reported by Exchanges to CAT via the Plan Participant Specification and the Industry Member table reflects order events reported by Industry Members to CAT via the Industry Member Specification. Quotation activity is not included here except in instances where listed options quotations result in trade activity. During 2022, additional event types became reportable and are reflected here.
4.2 Options Activity
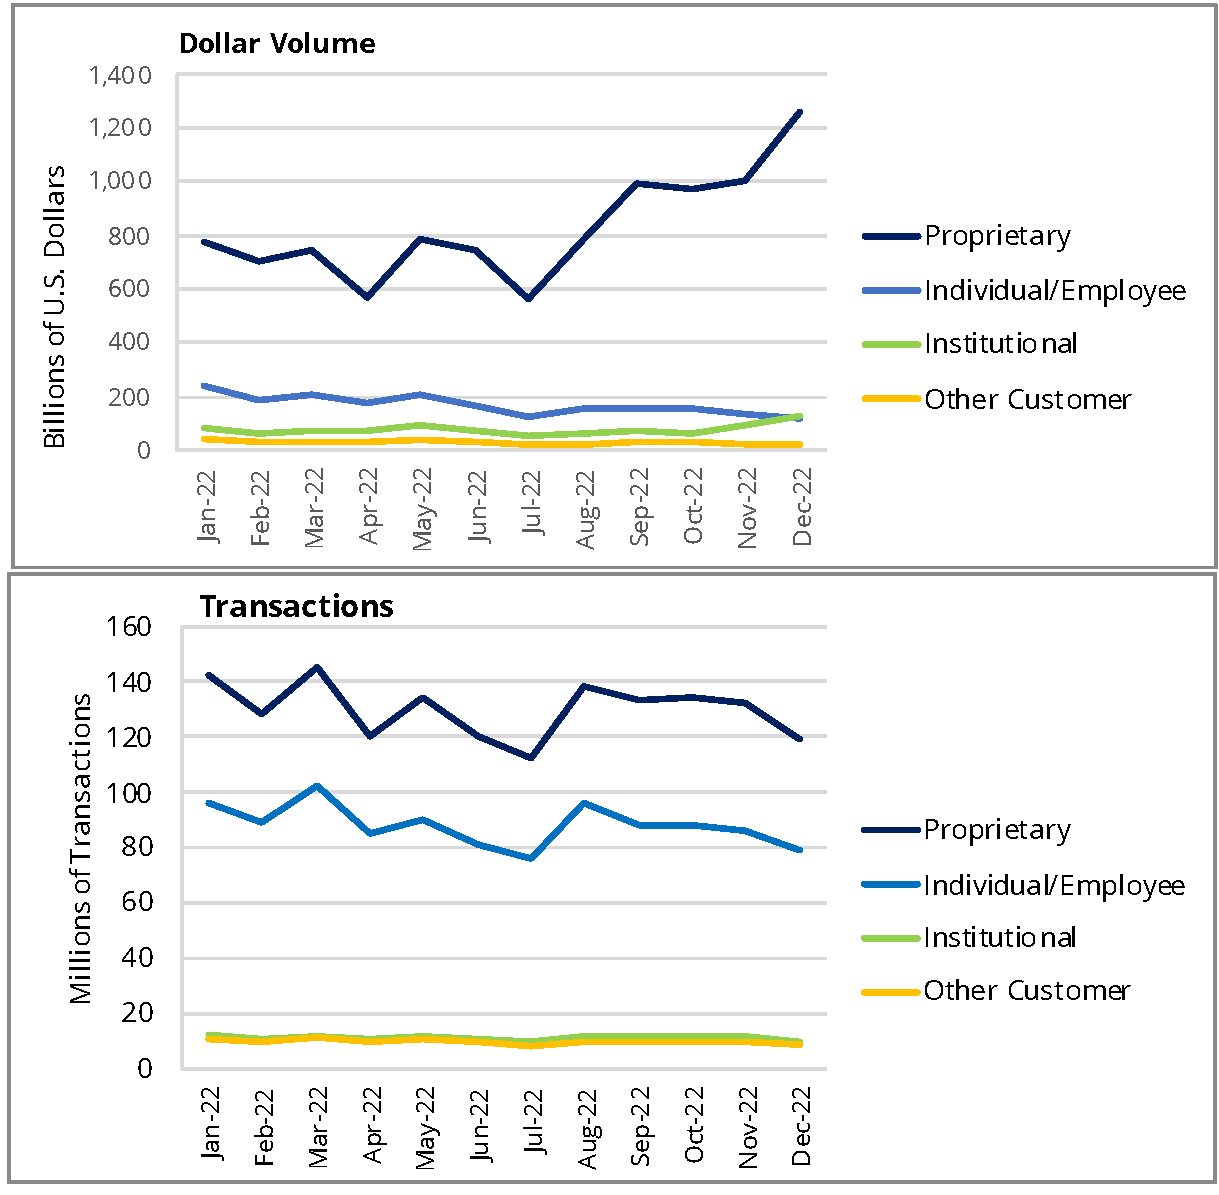
Figure 4.2.1 Options Trading Activity By Originating Account Owner Type, 20221
(January 3, 2022 − December 30, 2022)
Source: Financial Industry Regulatory Authority. Data as of February 2023.
1 Includes trades but not orders or quotations. Account Owner Type follows the “accountHolderType” categories in the CAT Reporting Technical Specifications for Industry Members. “Proprietary” activity is made up of the other proprietary, market making and error account categories as well as trades that do not have an explicit account owner type value (these are presumed to be market making trades). “Other Customer” includes the foreign and firm agency average price account categories.
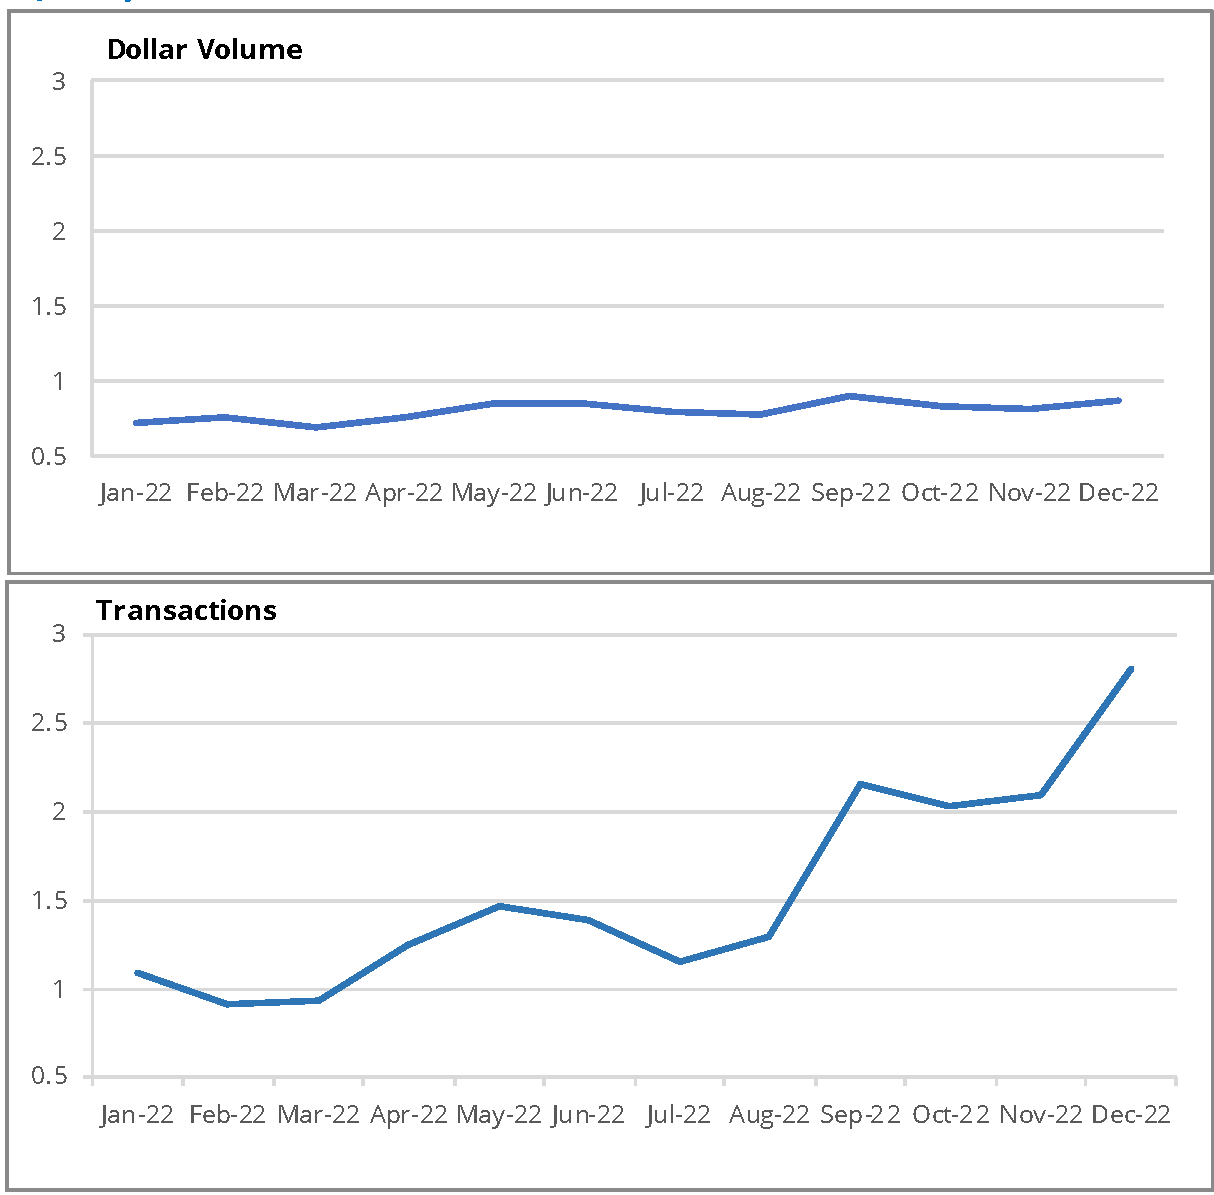
Figure 4.2.2 Put/Call Ratio by Volume and Transaction Count, 20221
(January 3, 2022 − December 30, 2022)
Source: Financial Industry Regulatory Authority. Data as of February 2023.
1 Based on trading activity as reported to CAT and processed by FINRA. The Put/Call ratio is defined as the monthly sum of puts divided by the monthly sum of calls in either measurement mode.
4.3 Demographic Changes
Figure 4.3.1 Age Distribution of U.S. Population and FINRA-Registered Representatives, 2010 & 20201
(Percent as of year-end)
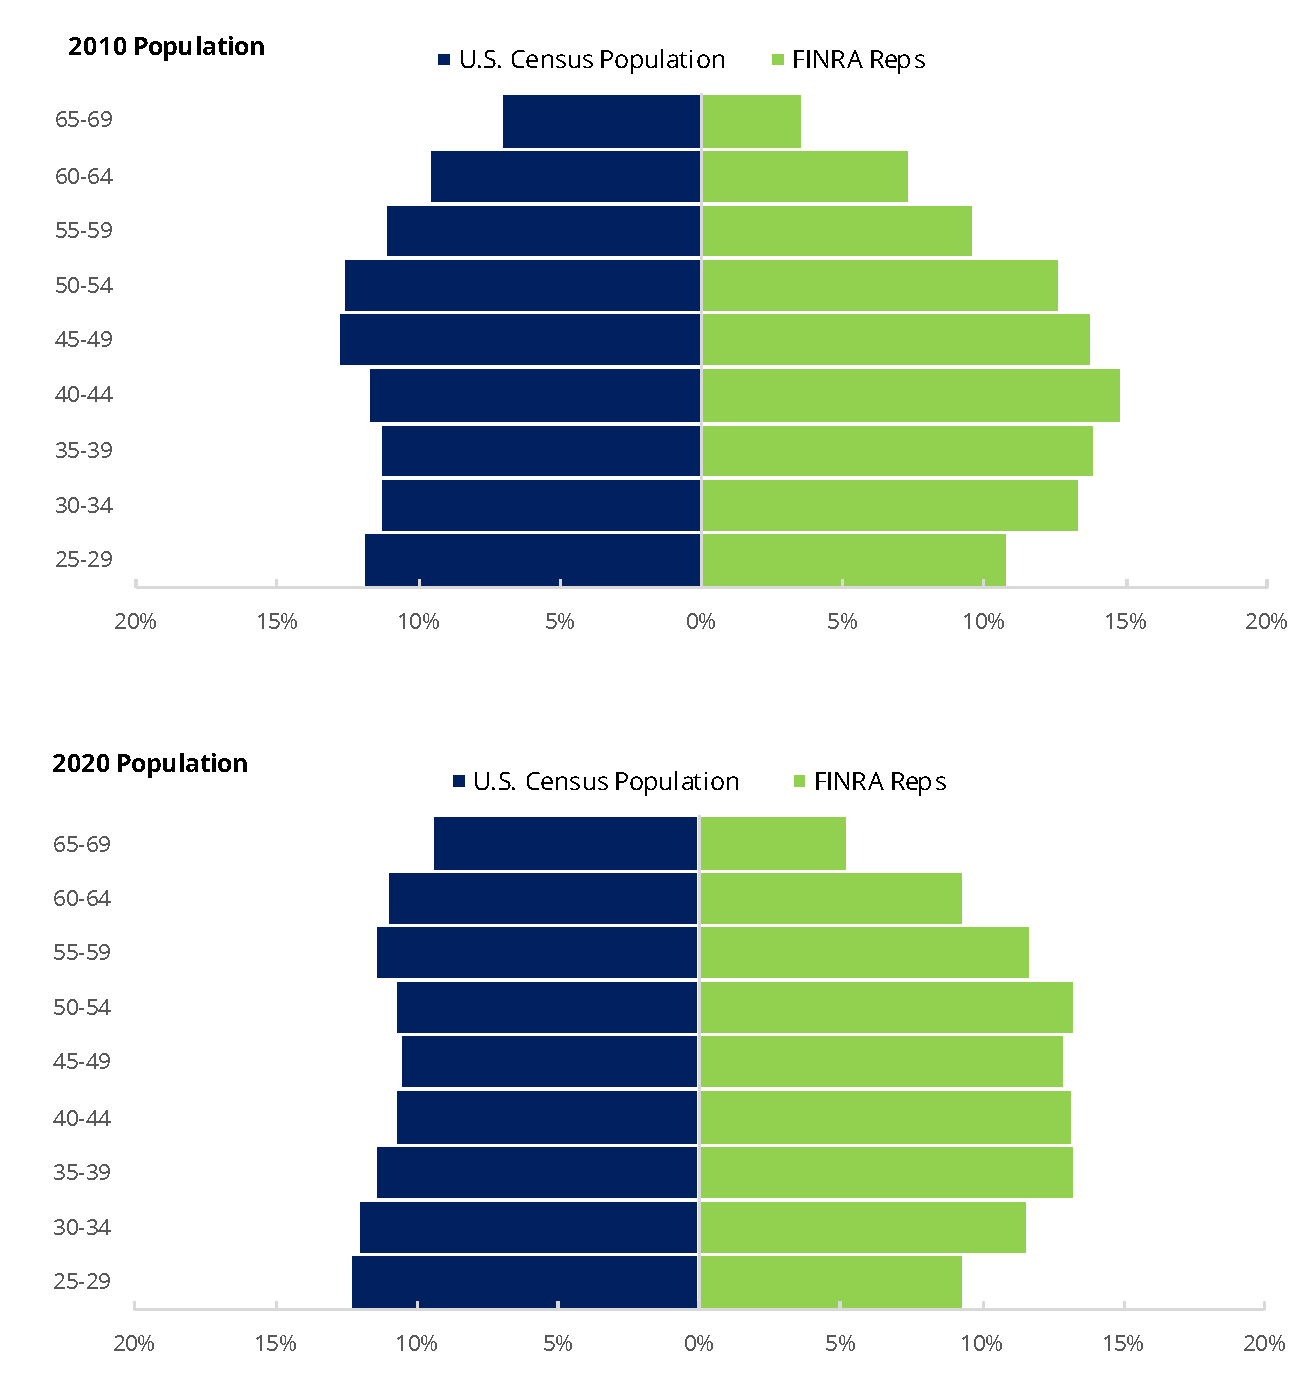
Sources: Financial Industry Regulatory Authority and U.S. Census Bureau.
1 Age distributions were truncated to represent individuals between 25 and 69 years old as of year-end. Percentages represented are from truncated age distributions for individuals between 25 and 69 years old as of year-end.
Figure 4.3.2 Age Distribution of FINRA-Registered Representives By Year and Firm Size
(Count as of year-end)
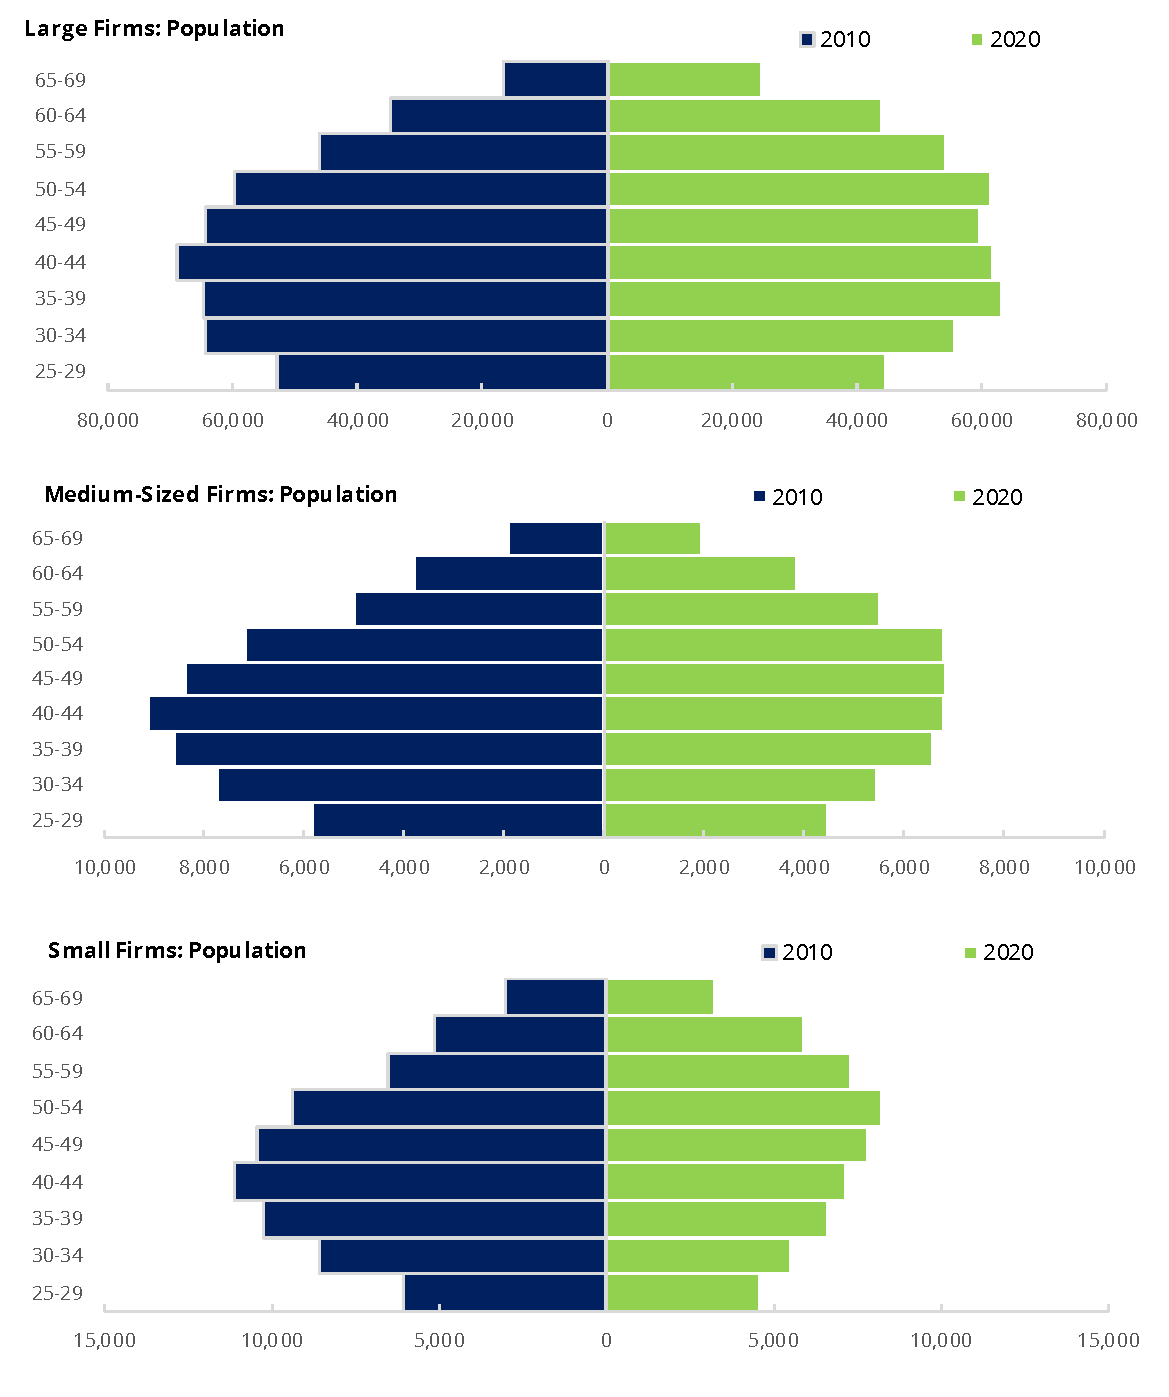
Source: Financial Industry Regulatory Authority.
1 Age distributions were truncated to represent individuals between 25 and 69 years old as of year-end. Individuals registered with multiple firms are counted once for each firm size they represent, potentially in multiple size classes depending on the sizes of the employing firms. Large Firm = 500 or more registered representatives; Mid-Size Firm = 151-499 registered representatives; Small Firm = 1-150 registered representatives.
4.4 Supplementary Liquidity Schedule
Figure 4.4.1 Providers of the Supplementary Liquidity Schedule – Type and Size, 20221
(Number of firms as of year-end)
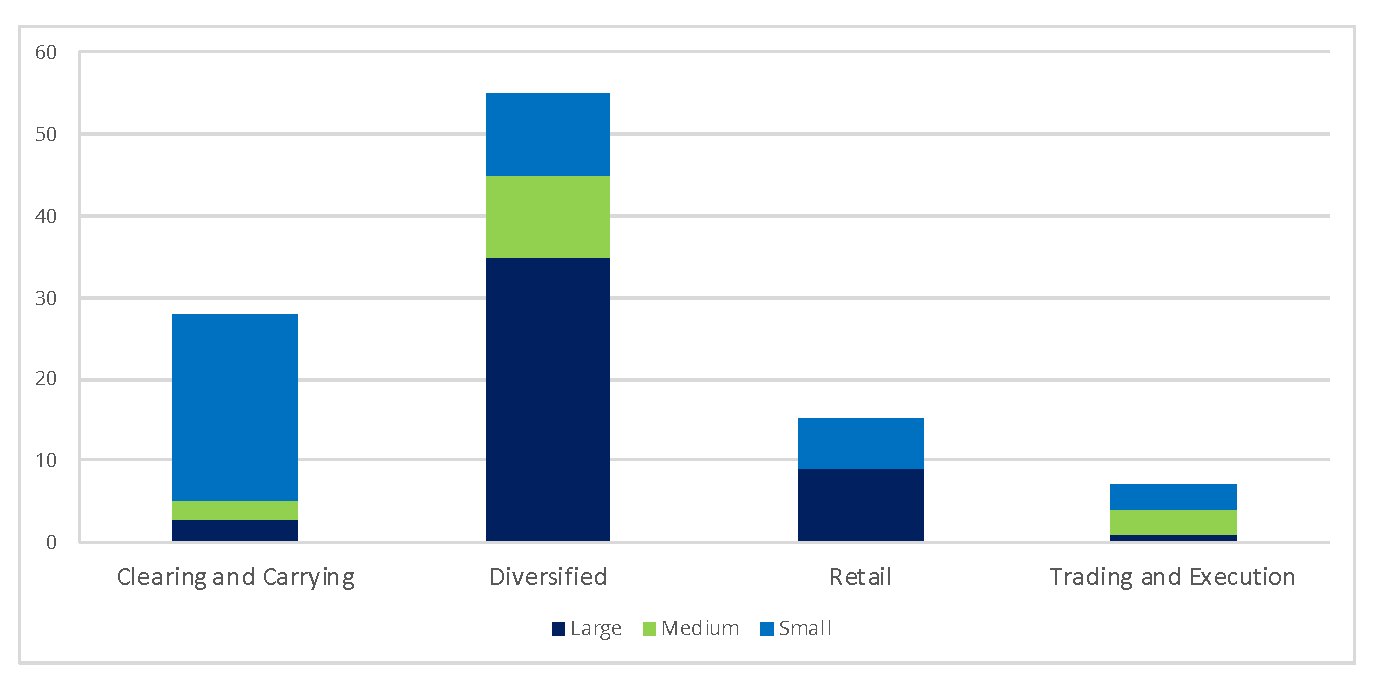
Source: Supplementary Liquidity Schedule
1 The SLS is designed to improve FINRA’s ability to monitor for events that signal adverse changes in the liquidity risk of FINRA’s members with the largest customer and counterparty exposures. The SLS must be filed by each FINRA-registered firm with $25 million or more in free credit balances, as defined under SEA Rule 15c3-3(a)(8), and also by each member whose aggregate amount outstanding under repurchase agreements, securities loan contracts and bank loans is equal to or greater than $1 billion. There were 105 such firms at the end of December 2022.
Figure 4.4.2 Collateral Types Used by Providers of the Supplementary Liquidity Schedule, 20221
(In billions of USD as of year-end)
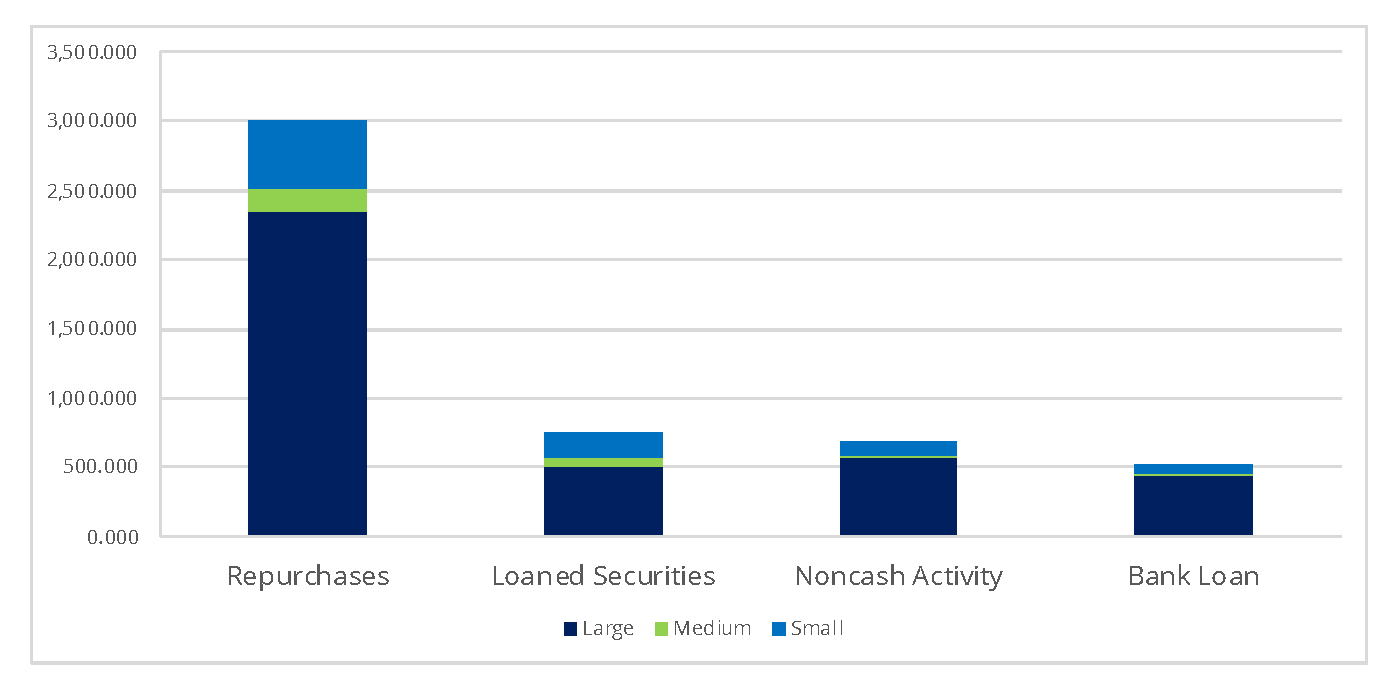
Source: Supplementary Liquidity Schedule
1 The SLS is designed to improve FINRA’s ability to monitor for events that signal adverse changes in the liquidity risk of FINRA’s members with the largest customer and counterparty exposures. The SLS must be filed by each FINRA-registered firm with $25 million or more in free credit balances, as defined under SEA Rule 15c3-3(a)(8), and also by each member whose aggregate amount outstanding under repurchase agreements, securities loan contracts and bank loans is equal to or greater than $1 billion. There were 105 such firms at the end of December 2022.
2 These statistics are appropriate for comparing and contrasting collateral types, but not for observing their total use in the market, as firms below the size threshold to submit the SLS are excluded. Noncash Activity Includes all exchanges without a cash component, including equity for equity repurchases.
4.5 National Financial Capability Study
Figure 4.5.1 Taxable Investment Account Ownership By Year1
(Estimated percentage of US adults)
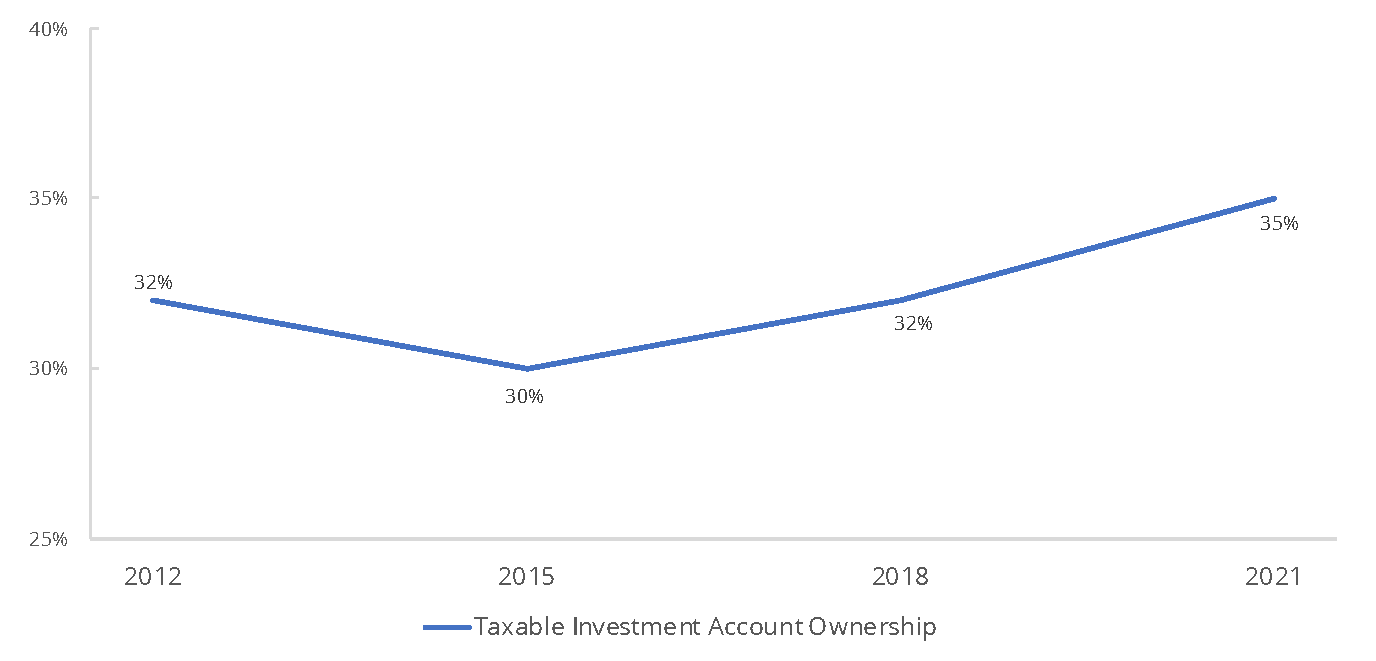
Source: 2012-2021 National Financial Capability Study
1 Taxable investments include investments in stocks, bonds, mutual funds or other securities outside of retirement accounts. Respondents were recruited via non-probability quota sampling using established online panels consisting of millions of individuals who have been recruited to join and who are offered incentives in exchange for participating in online surveys, with over 25,000 such individuals in each wave. Figures are weighted to be representative of the national population in terms of age, gender, ethnicity, education and Census Division. Adults includes all individuals over the age of 18.
Figure 4.5.2 Taxable Investment Account Ownership By Year and Generation1,2
(Estimated percentage of US adults in each generation)
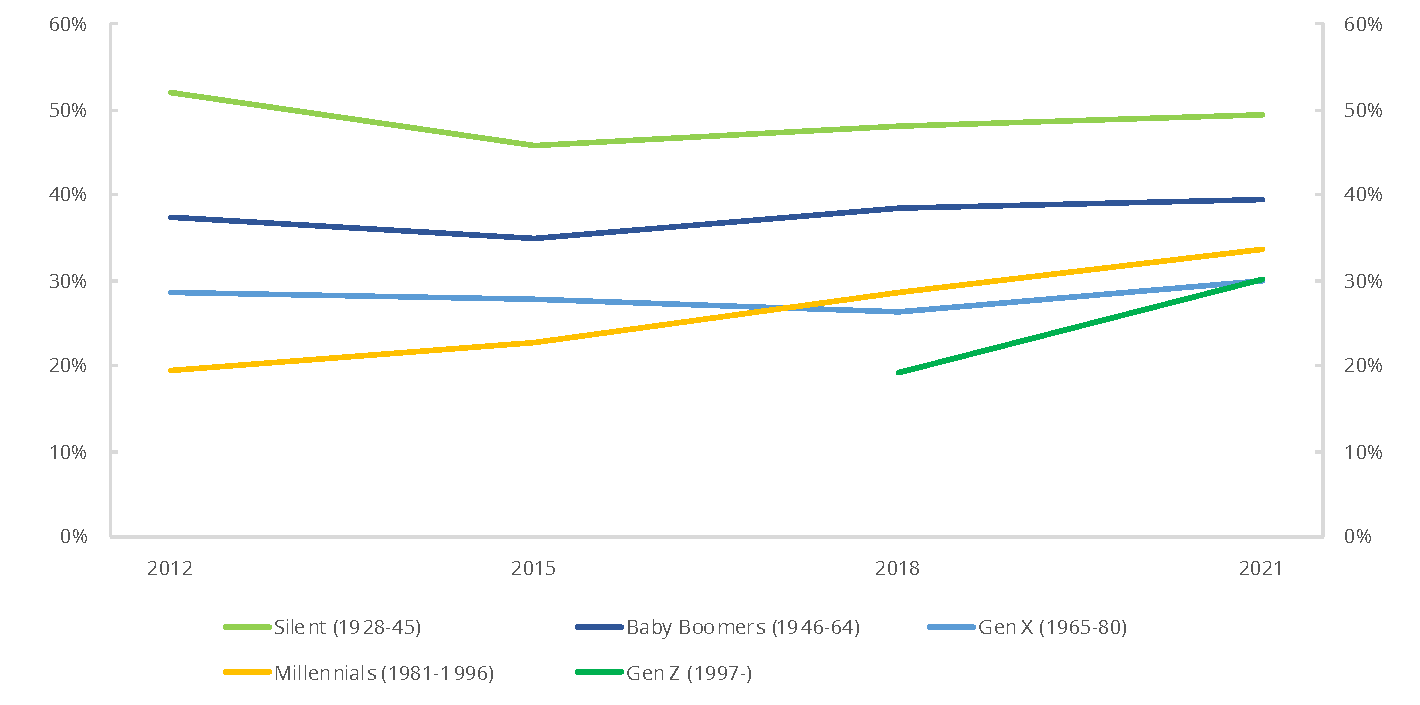
Source: 2012-2021 National Financial Capability Study
1 Taxable investments include investments in stocks, bonds, mutual funds or other securities outside of retirement accounts. Respondents were recruited via non-probability quota sampling using established online panels consisting of millions of individuals who have been recruited to join and who are offered incentives in exchange for participating in online surveys, with over 25,000 such individuals in each wave. Figures are weighted to be representative of the national population in terms of age, gender, ethnicity, education and Census Division. Adults includes all individuals over the age of 18.
2 Generation Definitions are provided by Pew Research. No Gen Z individuals were considered adults during the 2012 or 2015 waves.
Figure 4.5.3 Taxable Investment Account Ownership By Year, Race and Ethnicity1,2
(Estimated percentage of US adults in this ethnic group)
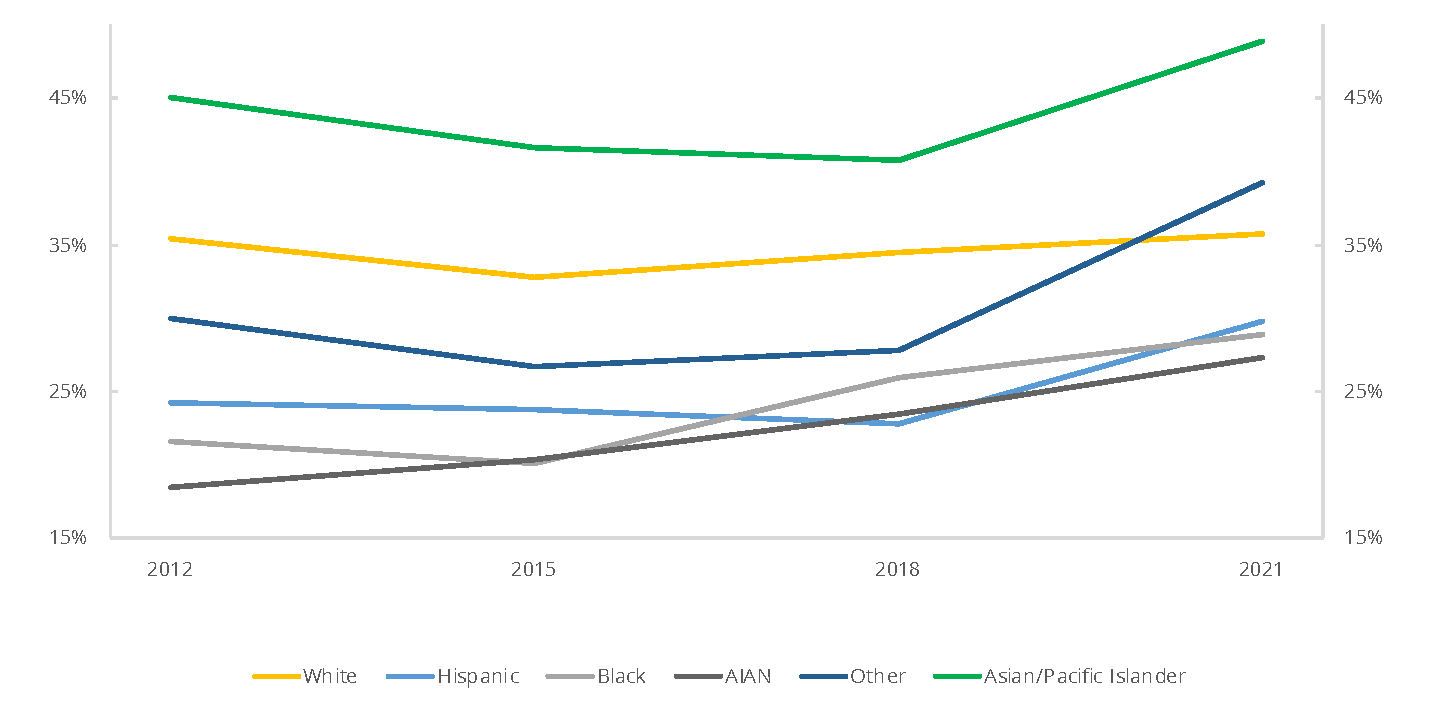
Source: 2012-2021 National Financial Capability Study
1 Taxable investments include investments in stocks, bonds, mutual funds or other securities outside of retirement accounts. Respondents were recruited via non-probability quota sampling using established online panels consisting of millions of individuals who have been recruited to join and who are offered incentives in exchange for participating in online surveys, with over 25,000 such individuals in each wave. Figures are weighted to be representative of the national population in terms of age, gender, ethnicity, education and Census Division. Adults includes all individuals over the age of 18.
2 Racial/Ethnic group based on self-identification. AIAN represents those who identify as American Indian or Alaska Natives. Multiethnic individuals are classified as "Other" unless they at partially identified as Hispanic, in which case they are classified in the Hispanic category.