Market Activity
Table of Contents
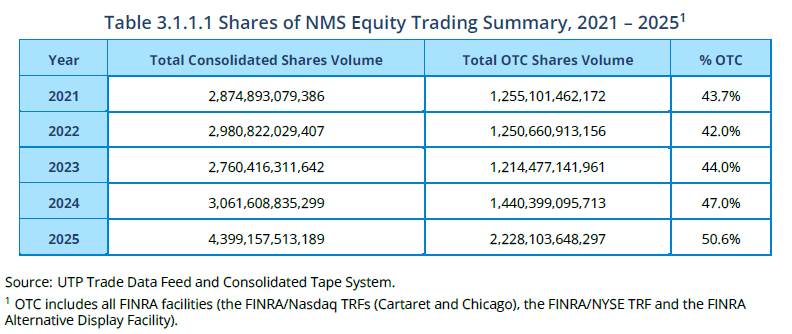
- Table 3.1.1.1 Shares of NMS Equity Trading Summary, 2021–2025
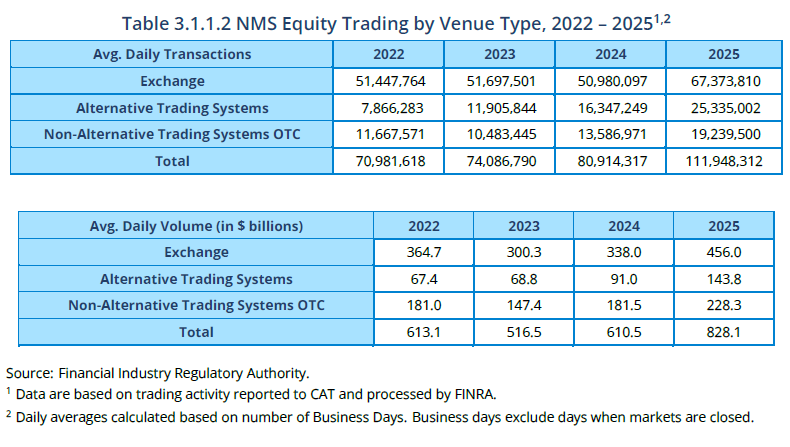
- Table 3.1.1.2 NMS Equity Trading by Venue Type, 2022–2025
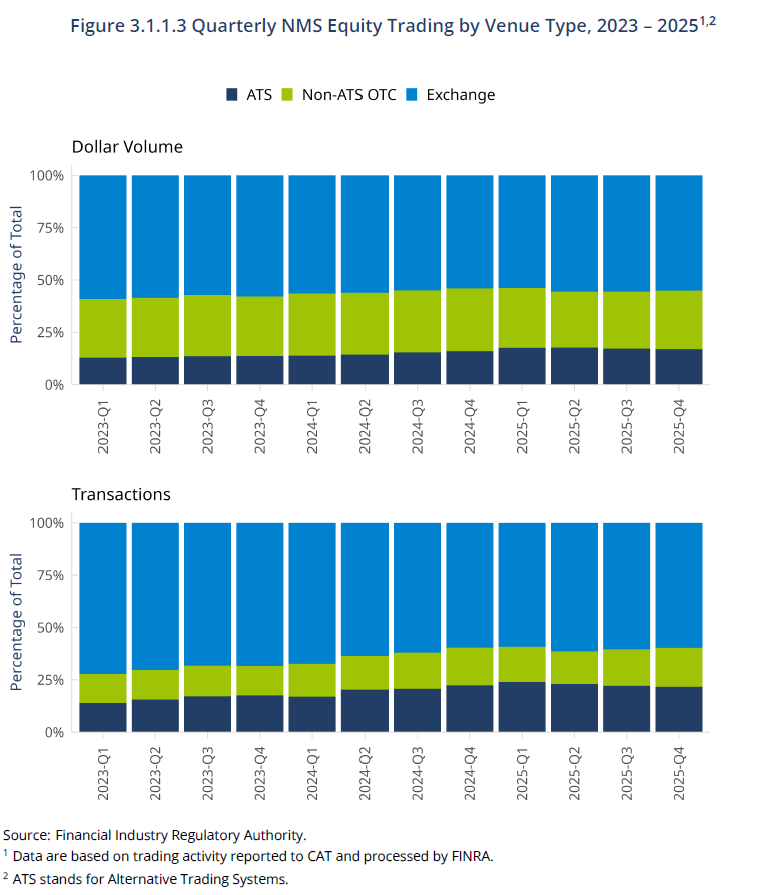
- Figure 3.1.1.3 Quarterly NMS Equity Trading by Venue Type, 2023-2025
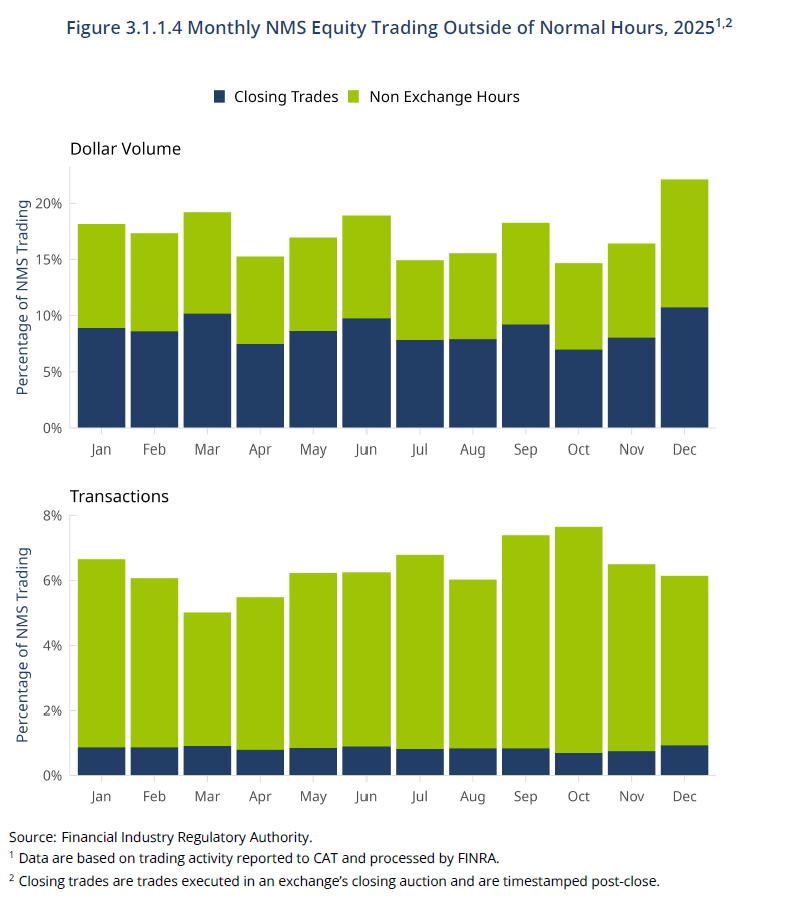
- Figure 3.1.1.4 Monthly NMS Equity Trading Outside of Normal Hours, 2025
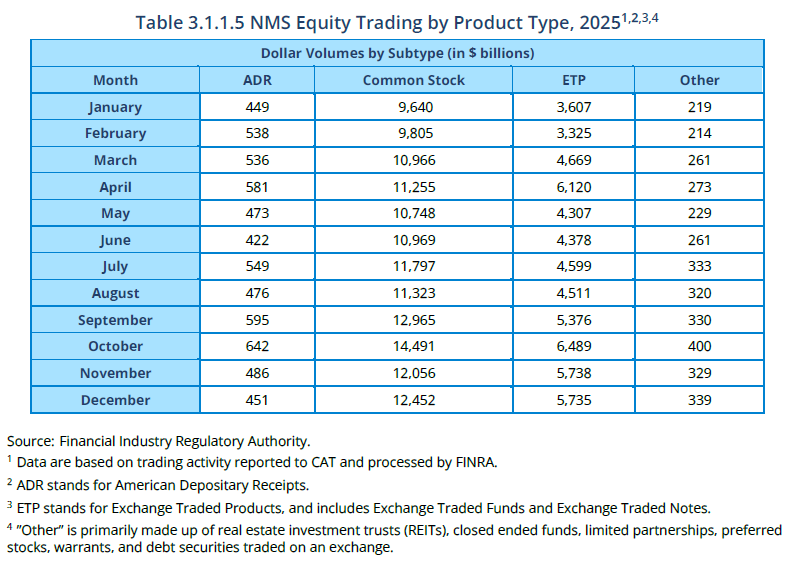
- Table 3.1.1.5 NMS Equity Trading by Product Type, 2025
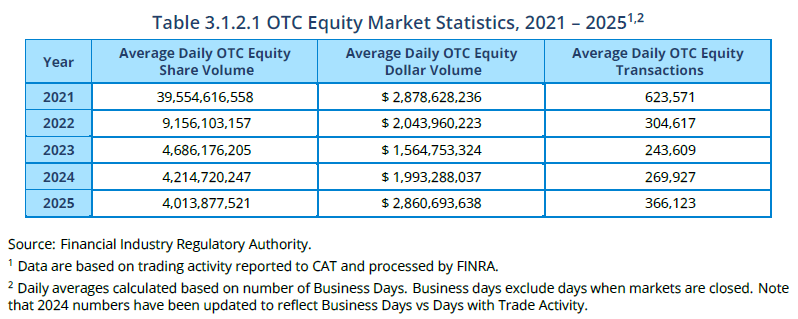
- Table 3.1.2.1 OTC Equity Market Statistics, 2021-2025
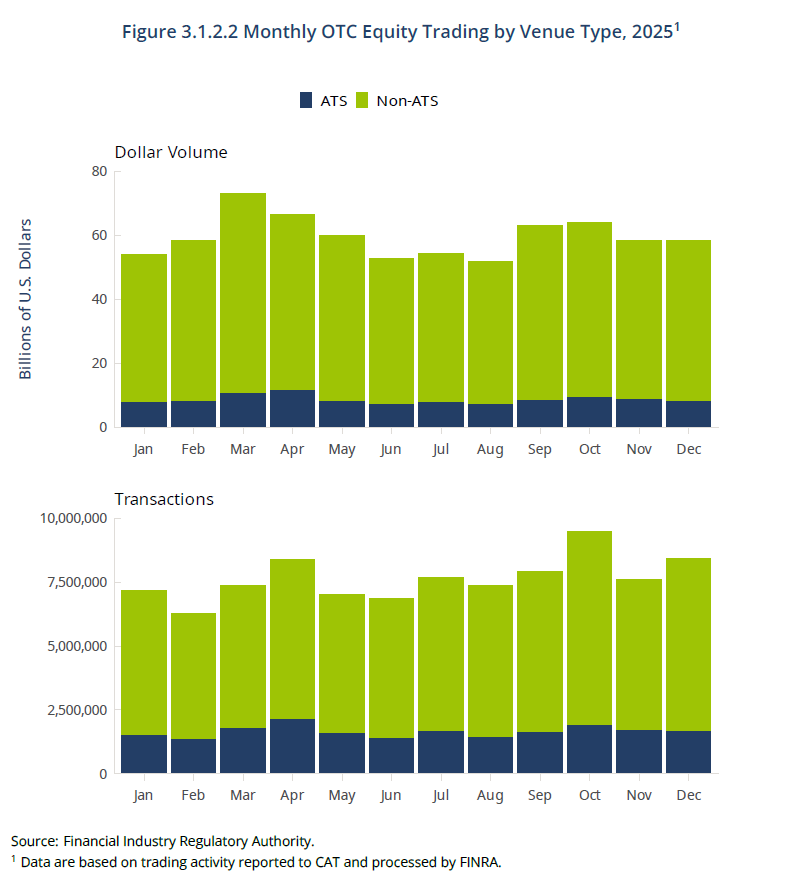
- Figure 3.1.2.2 Monthly OTC Equity Trading by Venue Type, 2025
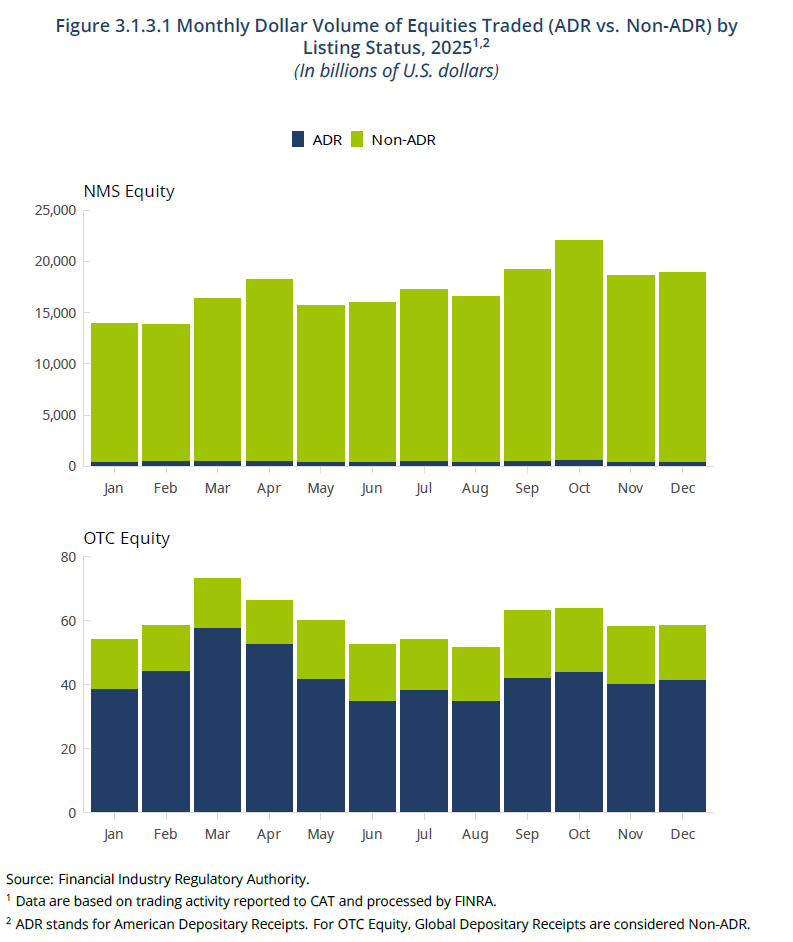
3.1.3 Market Activity for Equities Traded by Listing Status- Figure 3.1.3.1 Monthly Dollar Volume of Equities Traded (ADR vs. Non-ADR) by Listing Status, 2025
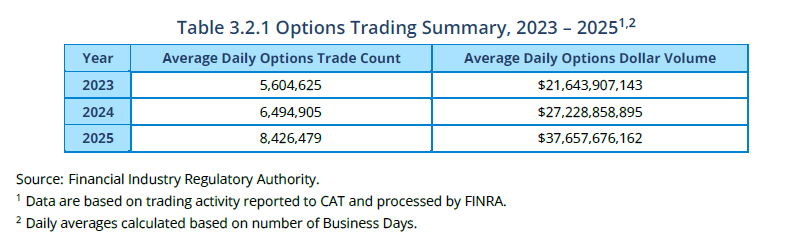
- Table 3.2.1 Options Trading Summary, 2023–2025
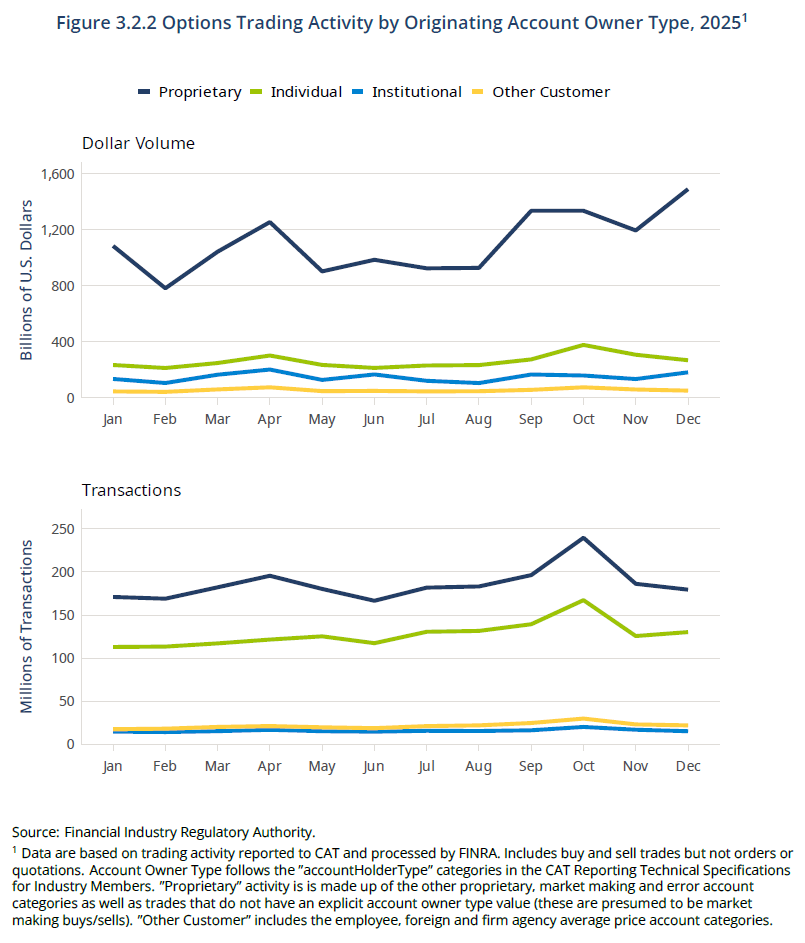
- Figure 3.2.2 Options Trading Activity By Originating Account Owner Type, 2025
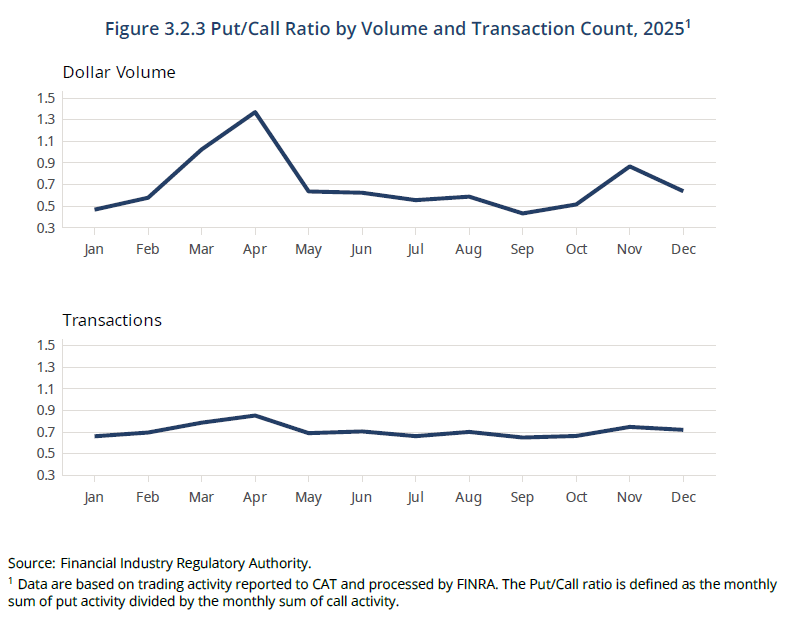
- Figure 3.2.3 Put/Call Ratio by Volume and Transaction Count, 2025
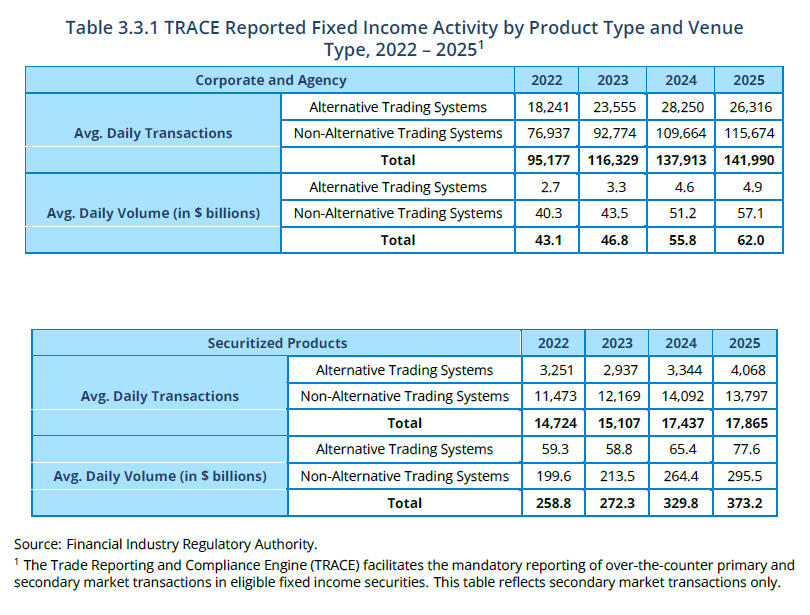
- Table 3.3.1 TRACE Reported Fixed Income Activity by Product Type and Venue Type, 2022−2025
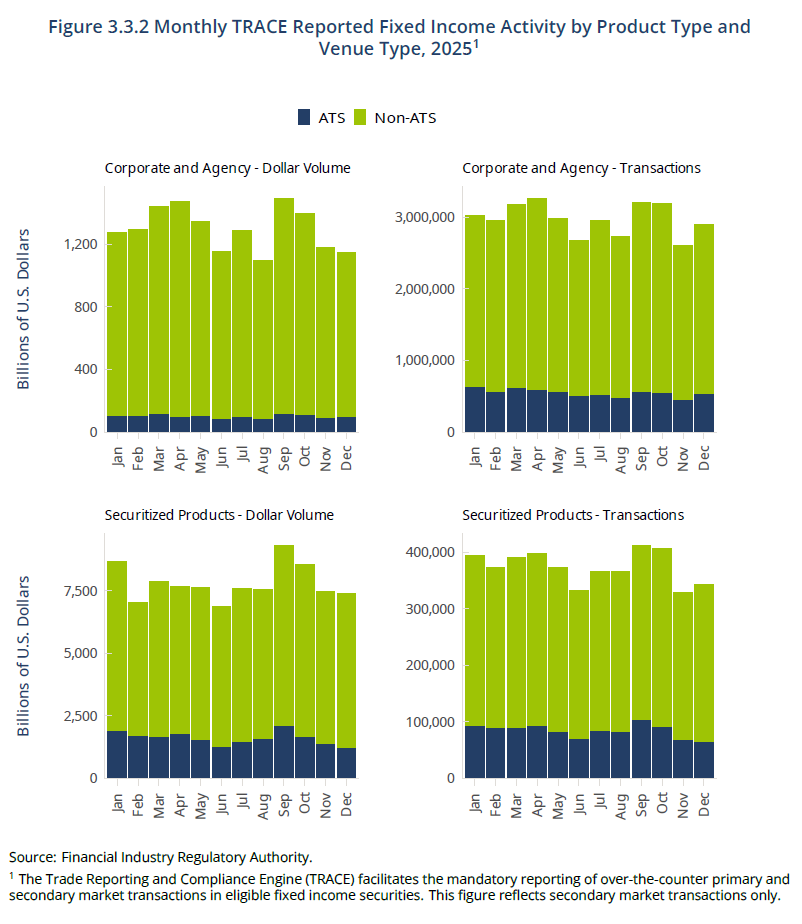
- Figure 3.3.2 Monthly TRACE Reported Fixed Income Activity By Product Type and Venue Type, 2025
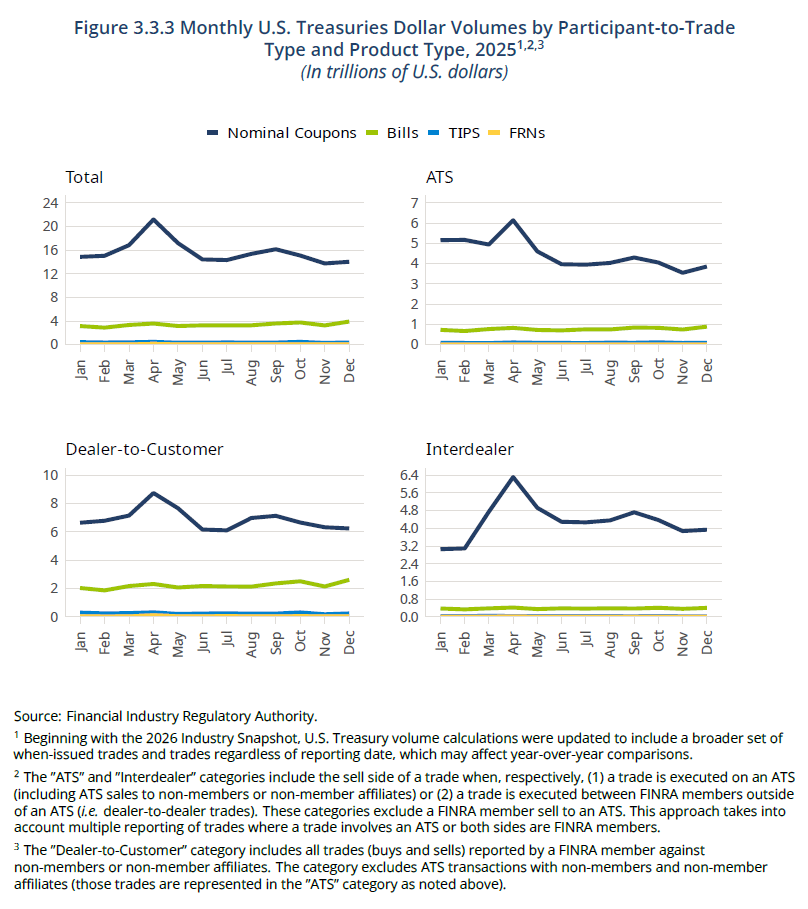
- Figure 3.3.3 Monthly U.S. Treasuries Dollar Volumes by Participant-to-Trade Type and Product Type, 2025
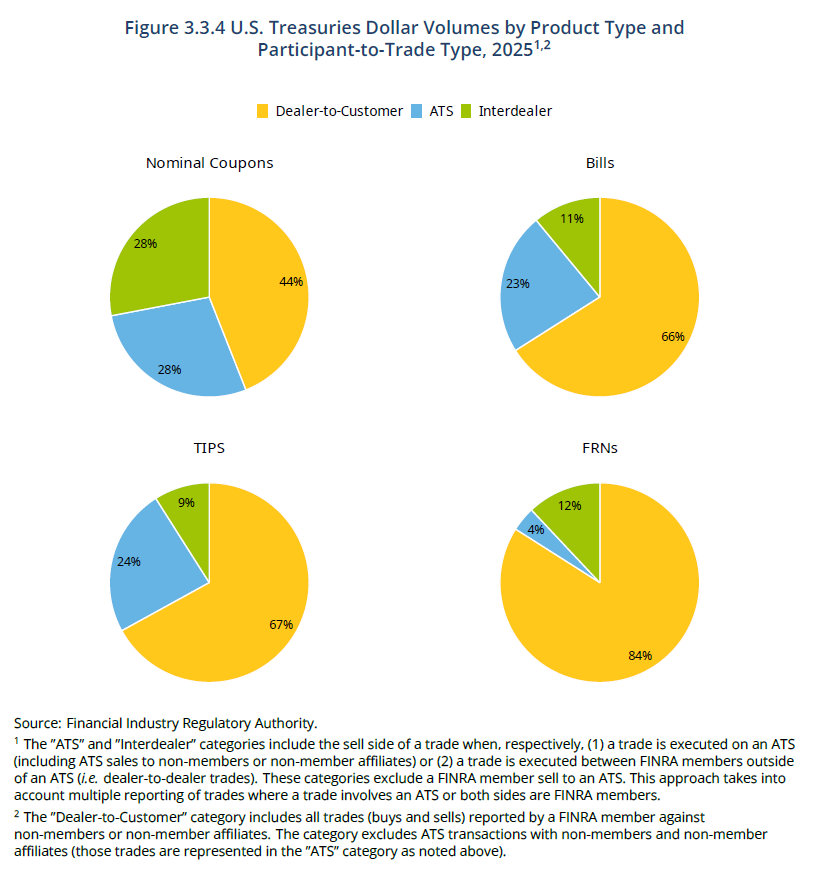
- Figure 3.3.4 U.S. Treasuries Dollar Volumes by Product Type and Participant-to-Trade Type, 2025
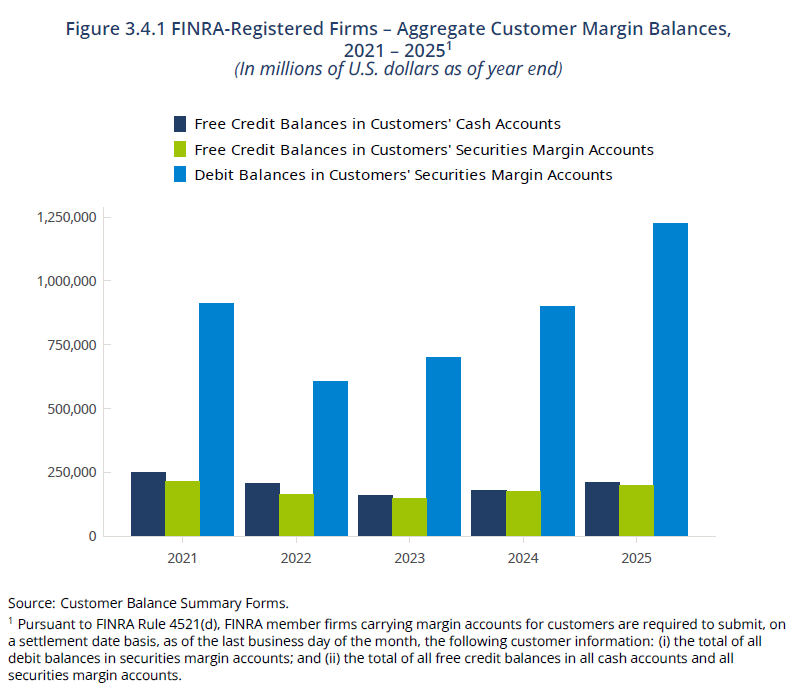
- Figure 3.4.1 FINRA-Registered Firms – Aggregate Customer Margin Balances, 2021-2025
FINRA collects certain market data as part of its role in overseeing trading and providing transparency services. Following are select tables drawn from that data.
3.1.1 National Market System
3.1.2 OTC Equity
3.1.3 Market Activity for Equities Traded by Listing Status
3.2 Options Activity
3.3 Fixed Income Activity
3.4 Customer Margin